Estimated Value: $608,660 - $760,000
5
Beds
1
Bath
1,954
Sq Ft
$336/Sq Ft
Est. Value
About This Home
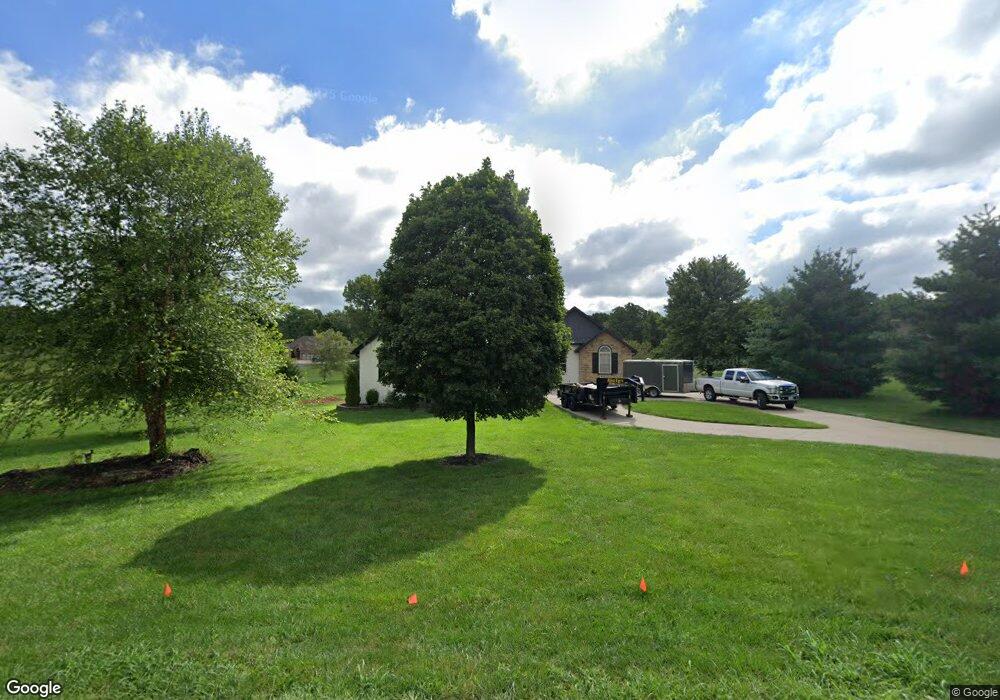
This home is located at 1678 N Carnegie Rd, Nixa, MO 65714 and is currently estimated at $656,165, approximately $335 per square foot. 1678 N Carnegie Rd is a home with nearby schools including High Pointe Elementary School, Summit Intermediate School, and Queens Gateway to Health Sciences Secondary School.
Ownership History
Date
Name
Owned For
Owner Type
Purchase Details
Closed on
Nov 25, 2024
Sold by
Bybee Scott E and Bybee Robbyn H
Bought by
Scott E And Robbyn H Bybee Revocable Trust and Bybee
Current Estimated Value
Purchase Details
Closed on
Jul 14, 2006
Sold by
Homeworks Construction L L C
Bought by
Bybee Scott E and Bybee Robbyn H
Home Financials for this Owner
Home Financials are based on the most recent Mortgage that was taken out on this home.
Original Mortgage
$317,000
Interest Rate
6.62%
Mortgage Type
New Conventional
Create a Home Valuation Report for This Property
The Home Valuation Report is an in-depth analysis detailing your home's value as well as a comparison with similar homes in the area
Home Values in the Area
Average Home Value in this Area
Purchase History
| Date | Buyer | Sale Price | Title Company |
|---|---|---|---|
| Scott E And Robbyn H Bybee Revocable Trust | -- | None Listed On Document | |
| Scott E And Robbyn H Bybee Revocable Trust | -- | None Listed On Document | |
| Bybee Scott E | -- | Lincoln Evans Land Title Com |
Source: Public Records
Mortgage History
| Date | Status | Borrower | Loan Amount |
|---|---|---|---|
| Previous Owner | Bybee Scott E | $317,000 |
Source: Public Records
Tax History Compared to Growth
Tax History
| Year | Tax Paid | Tax Assessment Tax Assessment Total Assessment is a certain percentage of the fair market value that is determined by local assessors to be the total taxable value of land and additions on the property. | Land | Improvement |
|---|---|---|---|---|
| 2024 | $4,300 | $72,470 | -- | -- |
| 2023 | $4,300 | $72,470 | $0 | $0 |
| 2022 | $4,193 | $70,570 | $0 | $0 |
| 2021 | $4,195 | $70,570 | $0 | $0 |
| 2020 | $3,998 | $64,320 | $0 | $0 |
| 2019 | $3,998 | $64,320 | $0 | $0 |
| 2018 | $3,708 | $64,320 | $0 | $0 |
| 2017 | $3,708 | $64,320 | $0 | $0 |
| 2016 | $3,646 | $64,320 | $0 | $0 |
| 2015 | $3,651 | $64,320 | $64,320 | $0 |
| 2014 | $3,553 | $64,260 | $0 | $0 |
| 2013 | $3,559 | $64,260 | $0 | $0 |
| 2011 | -- | $128,520 | $0 | $0 |
Source: Public Records
Map
Nearby Homes
- 869 E Sparrow Rd
- 1410 E Hayston Ave
- 1411 E Hayston Ave
- 2074 Cc Hwy
- 833 E Grouse Rd
- 871 Galway Ct
- 820 E Brewer Ave
- 861 Bantry Ct
- 824 E Kings Mead Cir Unit 1
- 144 Blue Jay Way
- 1419 Rich Hill Cir
- 867 E Edenmore Cir
- 592 E Hillwallen Place
- 8302 Rolling Hills Dr
- 714 N Fox Hill Cir
- 842 E Abbey Ct
- 4210 Greenbriar Dr
- 4807 Rolling Hills Dr
- 1373 N Rockingham Ave
- 711 N Greer Ave
- 0 N Carnegie Rd Unit 11211544
- 0 N Carnegie Rd Unit 60106479
- 000 N Carnegie Rd
- 1668 N Carnegie Rd
- 889 E Sparrow Rd
- 887 E Sparrow Rd
- 888 E Sparrow Rd
- 885 E Sparrow Rd
- 886 E Sparrow Rd
- 1686 N Carnegie Rd
- 883 E Sparrow Rd
- 1675 N Carnegie Rd
- 884 E Sparrow Rd
- 881 E Sparrow Rd
- 882 E Sparrow Rd
- 1643 N Carnegie Rd
- 880 E Sparrow Rd
- 1654 N Pigeon Rd
- 1658 N Pigeon Rd
- 1656 N Pigeon Rd