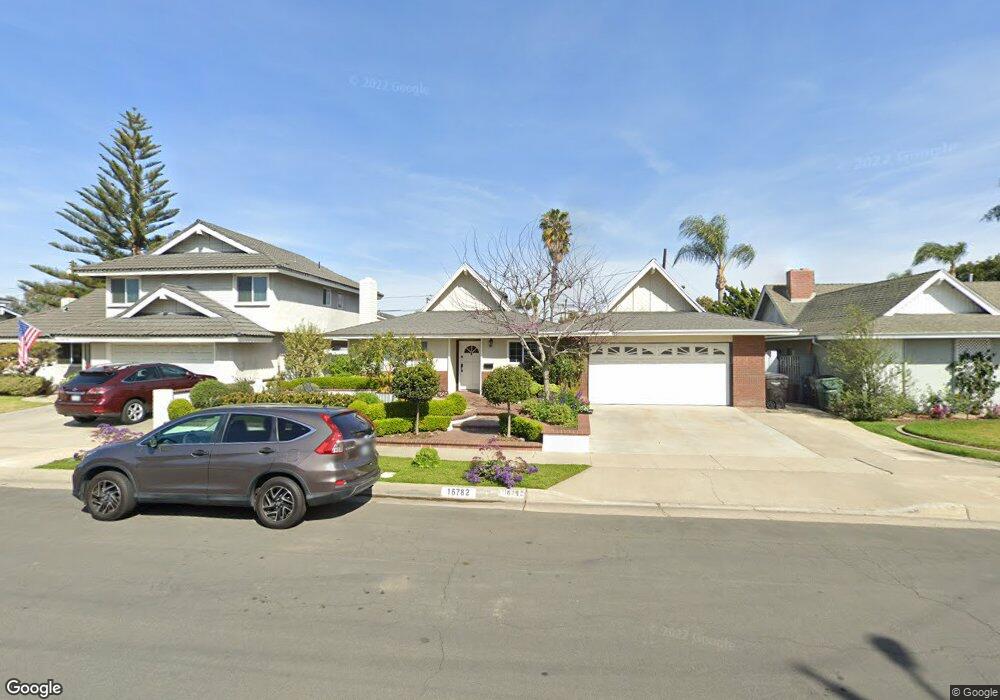
16782 Robert Ln Huntington Beach, CA 92647
Estimated Value: $1,212,826 - $1,288,000
3
Beds
2
Baths
1,406
Sq Ft
$893/Sq Ft
Est. Value
About This Home
This home is located at 16782 Robert Ln, Huntington Beach, CA 92647 and is currently estimated at $1,255,457, approximately $892 per square foot. 16782 Robert Ln is a home located in Orange County with nearby schools including Circle View Elementary School, Spring View Middle School, and Marina High School.
Ownership History
Date
Name
Owned For
Owner Type
Purchase Details
Closed on
Dec 29, 2008
Sold by
Kling Thomas M and Kling Setsuko S
Bought by
Kling Thomas M and Kling Setsuko Susan
Current Estimated Value
Purchase Details
Closed on
May 17, 2000
Sold by
William Godwin and William Kevan
Bought by
Kling Thomas M and Kling Setsuko S
Home Financials for this Owner
Home Financials are based on the most recent Mortgage that was taken out on this home.
Original Mortgage
$242,000
Outstanding Balance
$83,483
Interest Rate
8.12%
Estimated Equity
$1,171,974
Purchase Details
Closed on
Sep 5, 1996
Sold by
Moeller Debra A
Bought by
Godwin William and Godwin Kevan
Home Financials for this Owner
Home Financials are based on the most recent Mortgage that was taken out on this home.
Original Mortgage
$215,100
Interest Rate
8.1%
Create a Home Valuation Report for This Property
The Home Valuation Report is an in-depth analysis detailing your home's value as well as a comparison with similar homes in the area
Home Values in the Area
Average Home Value in this Area
Purchase History
| Date | Buyer | Sale Price | Title Company |
|---|---|---|---|
| Kling Thomas M | -- | None Available | |
| Kling Thomas M | $329,000 | United Title Company | |
| Godwin William | $239,000 | Fidelity National Title Ins |
Source: Public Records
Mortgage History
| Date | Status | Borrower | Loan Amount |
|---|---|---|---|
| Open | Kling Thomas M | $242,000 | |
| Previous Owner | Godwin William | $215,100 |
Source: Public Records
Tax History Compared to Growth
Tax History
| Year | Tax Paid | Tax Assessment Tax Assessment Total Assessment is a certain percentage of the fair market value that is determined by local assessors to be the total taxable value of land and additions on the property. | Land | Improvement |
|---|---|---|---|---|
| 2025 | $5,744 | $505,656 | $399,692 | $105,964 |
| 2024 | $5,744 | $495,742 | $391,855 | $103,887 |
| 2023 | $5,612 | $486,022 | $384,172 | $101,850 |
| 2022 | $5,527 | $476,493 | $376,640 | $99,853 |
| 2021 | $5,426 | $467,150 | $369,254 | $97,896 |
| 2020 | $5,364 | $462,360 | $365,467 | $96,893 |
| 2019 | $5,271 | $453,295 | $358,301 | $94,994 |
| 2018 | $5,153 | $444,407 | $351,275 | $93,132 |
| 2017 | $5,070 | $435,694 | $344,388 | $91,306 |
| 2016 | $4,863 | $427,151 | $337,635 | $89,516 |
| 2015 | $4,788 | $420,735 | $332,563 | $88,172 |
| 2014 | $4,693 | $412,494 | $326,049 | $86,445 |
Source: Public Records
Map
Nearby Homes
- 6301 Warner Ave Unit 88
- 6301 Warner Ave Unit 40
- 16652 Busby Ln
- 17071 Pinehurst Ln
- 6292 Heil Ave
- 6351 Gloria Dr
- 6051 Summerdale Dr
- 6600 Warner Ave Unit 50
- 6600 Warner Ave
- 17231 Lido Ln
- 16542 Los Verdes Ln
- 6672 Sun Dr Unit B
- 16892 Limelight Cir Unit B
- 16261 Angler Ln
- 17042 Twain Ln
- 5591 Heil Ave
- 17372 Forbes Ln
- 16722 Goldenwest St
- 17352 Eucalyptus Ln
- 6611 Crista Palma Dr
- 16772 Robert Ln
- 16792 Robert Ln
- 16781 Trudy Ln
- 16771 Trudy Ln
- 16791 Trudy Ln
- 16762 Robert Ln
- 16761 Trudy Ln
- 16781 Robert Ln
- 16771 Robert Ln
- 16791 Robert Ln
- 16752 Robert Ln
- 16751 Trudy Ln
- 6202 Shields Dr
- 6222 Shields Dr
- 6192 Shields Dr
- 6232 Shields Dr
- 16742 Robert Ln
- 16751 Robert Ln
- 6252 Farinella Dr
- 6251 Shields Dr