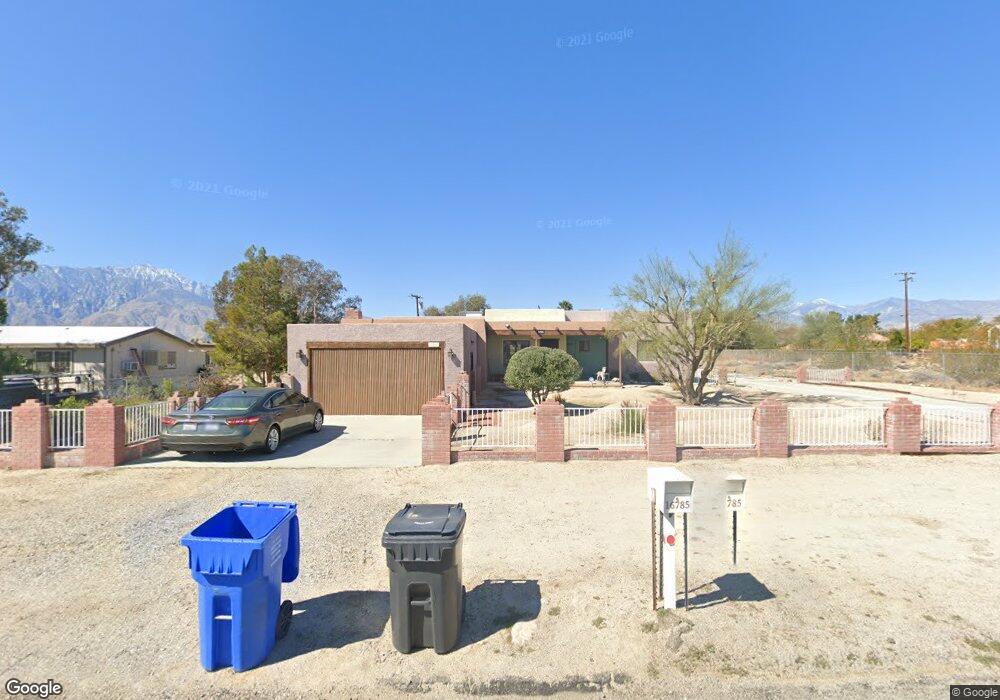
16785 Avenida Manzana Desert Hot Springs, CA 92240
Estimated Value: $198,000 - $427,778
4
Beds
3
Baths
2,140
Sq Ft
$170/Sq Ft
Est. Value
About This Home
This home is located at 16785 Avenida Manzana, Desert Hot Springs, CA 92240 and is currently estimated at $364,695, approximately $170 per square foot. 16785 Avenida Manzana is a home located in Riverside County with nearby schools including Bubbling Wells Elementary School, Desert Springs Middle School, and Desert Hot Springs High School.
Ownership History
Date
Name
Owned For
Owner Type
Purchase Details
Closed on
Mar 18, 2020
Sold by
Cohen Sheri and Lisi Mary
Bought by
Lisi Mary and Cohen Sheri
Current Estimated Value
Purchase Details
Closed on
Sep 15, 1999
Sold by
Sec Hud
Bought by
Cohen Sheri and Lisi Mary
Home Financials for this Owner
Home Financials are based on the most recent Mortgage that was taken out on this home.
Original Mortgage
$84,867
Outstanding Balance
$25,064
Interest Rate
7.77%
Mortgage Type
Purchase Money Mortgage
Estimated Equity
$339,632
Purchase Details
Closed on
Apr 10, 1998
Sold by
Midfirst Bank
Bought by
Hud
Purchase Details
Closed on
Dec 4, 1997
Sold by
Stephanoff and Antoanet
Bought by
Midfirst Bank
Purchase Details
Closed on
Jan 5, 1997
Sold by
Stephan Stephanoff
Bought by
Ilieva Sonia Nikolaeva
Purchase Details
Closed on
Nov 28, 1995
Sold by
Stephanoff Antoanet
Bought by
Stephanoff Stephan
Create a Home Valuation Report for This Property
The Home Valuation Report is an in-depth analysis detailing your home's value as well as a comparison with similar homes in the area
Home Values in the Area
Average Home Value in this Area
Purchase History
| Date | Buyer | Sale Price | Title Company |
|---|---|---|---|
| Lisi Mary | -- | None Available | |
| Cohen Sheri | $85,000 | Benefit Land Title | |
| Hud | -- | United Title Company | |
| Midfirst Bank | $98,801 | United Title Company | |
| Ilieva Sonia Nikolaeva | $135,000 | -- | |
| Stephanoff Stephan | -- | -- |
Source: Public Records
Mortgage History
| Date | Status | Borrower | Loan Amount |
|---|---|---|---|
| Open | Cohen Sheri | $84,867 |
Source: Public Records
Tax History Compared to Growth
Tax History
| Year | Tax Paid | Tax Assessment Tax Assessment Total Assessment is a certain percentage of the fair market value that is determined by local assessors to be the total taxable value of land and additions on the property. | Land | Improvement |
|---|---|---|---|---|
| 2025 | $4,823 | $130,700 | $9,203 | $121,497 |
| 2023 | $4,823 | $125,627 | $8,847 | $116,780 |
| 2022 | $4,840 | $123,165 | $8,674 | $114,491 |
| 2021 | $4,807 | $120,751 | $8,504 | $112,247 |
| 2020 | $4,738 | $119,514 | $8,417 | $111,097 |
| 2019 | $4,705 | $117,171 | $8,252 | $108,919 |
| 2018 | $4,647 | $114,875 | $8,092 | $106,783 |
| 2017 | $4,056 | $112,624 | $7,934 | $104,690 |
| 2016 | $4,487 | $110,417 | $7,779 | $102,638 |
| 2015 | $3,961 | $108,761 | $7,663 | $101,098 |
| 2014 | $1,534 | $106,632 | $7,514 | $99,118 |
Source: Public Records
Map
Nearby Homes
- 0 Dillion Rd Unit 219129810PS
- 17366 Avenida Manzana
- 16830 Via Corto W
- 16125 Via Vista
- 0 Avenida Garcia
- 8 Camino Aventura
- 0 Avenida Atezada Unit 219128335DA
- 16347 Avenue Atezada
- 17755 Avenida Manzana
- 66735 El Dorado Place
- 16295 Avenida Atezada
- 13800 Palm Dr
- 643 Palm Dr
- 14601 Palm Dr
- 22215 Palm Dr
- 66631 Thunderbird Ln
- 57 Palm Dr
- 12061 Palm Dr
- 56 Palm Dr
- 55 Palm Dr
- 16825 Avenida Manzana
- 16780 Via Montana
- 16820 Via Montana
- 16740 Via Montana
- 16705 Avenida Manzana
- 16700 Via Montana
- 16800 Via Montana Via Quedo
- 0 Via Quedo Montana Unit 215022506DA
- 16665 Avenida Manzana
- 16660 Via Montana
- 16900 Via Montana
- 16885 Avenida Manzana
- 16625 Avenida Manzana
- 16785 Via Montana
- 16785 Vía Montana
- 16745 Via Montana
- 16620 Via Montana
- 16865 Avenida Manzana
- 16980 Via Montana
- 66900 Dillon Rd