Estimated Value: $103,141
--
Bed
--
Bath
1,503
Sq Ft
$69/Sq Ft
Est. Value
About This Home
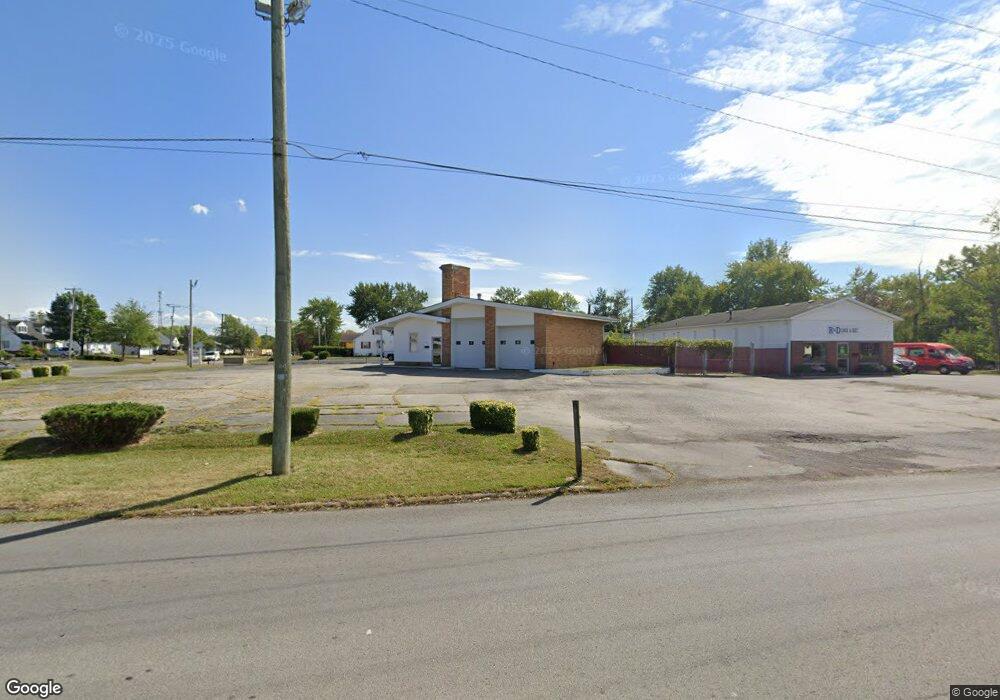
This home is located at 1679 N Main St, Lima, OH 45801 and is currently estimated at $103,141, approximately $68 per square foot. 1679 N Main St is a home located in Allen County with nearby schools including Independence Elementary School, Lima North Middle School, and Lima West Middle School.
Ownership History
Date
Name
Owned For
Owner Type
Purchase Details
Closed on
Oct 18, 2019
Sold by
Michael Ricky
Bought by
Vermillion Douglas
Current Estimated Value
Home Financials for this Owner
Home Financials are based on the most recent Mortgage that was taken out on this home.
Original Mortgage
$44,000
Outstanding Balance
$19,786
Interest Rate
3.4%
Mortgage Type
Future Advance Clause Open End Mortgage
Estimated Equity
$83,355
Purchase Details
Closed on
Dec 22, 2015
Sold by
Hhp Corp
Bought by
Michael Ricky
Purchase Details
Closed on
Nov 7, 2002
Sold by
Northland Marathon Inc
Bought by
Hhp Inc
Purchase Details
Closed on
Oct 12, 1994
Sold by
Klufta Thomas
Bought by
Northland Marathon Inc
Home Financials for this Owner
Home Financials are based on the most recent Mortgage that was taken out on this home.
Original Mortgage
$75,000
Interest Rate
8.55%
Mortgage Type
Commercial
Purchase Details
Closed on
Jun 17, 1988
Bought by
Klufta Thomas R
Create a Home Valuation Report for This Property
The Home Valuation Report is an in-depth analysis detailing your home's value as well as a comparison with similar homes in the area
Home Values in the Area
Average Home Value in this Area
Purchase History
| Date | Buyer | Sale Price | Title Company |
|---|---|---|---|
| Vermillion Douglas | $55,000 | None Available | |
| Michael Ricky | $55,000 | None Available | |
| Hhp Inc | $75,000 | -- | |
| Northland Marathon Inc | $69,000 | -- | |
| Klufta Thomas R | $49,000 | -- |
Source: Public Records
Mortgage History
| Date | Status | Borrower | Loan Amount |
|---|---|---|---|
| Open | Vermillion Douglas | $44,000 | |
| Previous Owner | Northland Marathon Inc | $75,000 |
Source: Public Records
Tax History Compared to Growth
Tax History
| Year | Tax Paid | Tax Assessment Tax Assessment Total Assessment is a certain percentage of the fair market value that is determined by local assessors to be the total taxable value of land and additions on the property. | Land | Improvement |
|---|---|---|---|---|
| 2024 | $2,210 | $21,500 | $16,910 | $4,590 |
| 2023 | $2,178 | $19,540 | $15,370 | $4,170 |
| 2022 | $2,133 | $19,540 | $15,370 | $4,170 |
| 2021 | $2,184 | $19,540 | $15,370 | $4,170 |
| 2020 | $1,633 | $19,400 | $15,370 | $4,030 |
| 2019 | $1,633 | $19,400 | $15,370 | $4,030 |
| 2018 | $1,673 | $19,400 | $15,370 | $4,030 |
| 2017 | $1,657 | $19,400 | $15,370 | $4,030 |
| 2016 | $1,672 | $19,400 | $15,370 | $4,030 |
| 2015 | $2,062 | $25,980 | $21,950 | $4,030 |
| 2014 | $2,131 | $28,040 | $21,950 | $6,090 |
| 2013 | $2,076 | $28,040 | $21,950 | $6,090 |
Source: Public Records
Map
Nearby Homes
- 128 E Lane Ave
- 105 Watt Ave
- 400 W Northern Ave
- 1200 N Main St
- 340 W Robb Ave
- 1776 Virginia Ave
- 2104 Virginia Ave
- 711 Taylor Ave
- 700 Lewis Blvd
- 610 W Robb Ave
- 608 W O'Connor Ave
- 168 Lyre Bird Ln
- 939 N West St
- 2370 N McDonel St
- 765 W O'Connor Ave
- 123 Flanders Ave
- 222 W Grand Ave
- 849 Runyan Ave
- 1116 Belvidere Ave
- 2371 Mandolin Dr