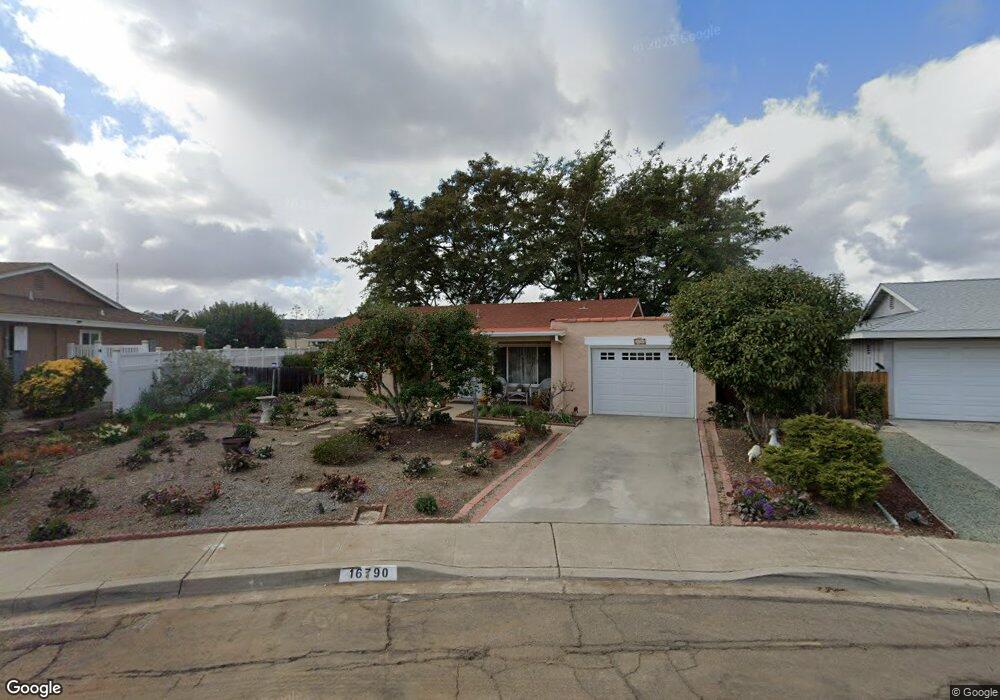
16790 Diego Dr Unit 4 San Diego, CA 92128
Rancho Bernardo NeighborhoodEstimated Value: $727,093 - $806,000
2
Beds
1
Bath
1,000
Sq Ft
$763/Sq Ft
Est. Value
About This Home
This home is located at 16790 Diego Dr Unit 4, San Diego, CA 92128 and is currently estimated at $762,773, approximately $762 per square foot. 16790 Diego Dr Unit 4 is a home located in San Diego County with nearby schools including Highland Ranch Elementary School, Bernardo Heights Middle, and Rancho Bernardo High.
Ownership History
Date
Name
Owned For
Owner Type
Purchase Details
Closed on
Mar 21, 2011
Sold by
Garanian Carolyn
Bought by
Garanian Carolyn
Current Estimated Value
Purchase Details
Closed on
Jan 17, 2003
Sold by
Eden Alene Robin
Bought by
Garanian Carolyn
Home Financials for this Owner
Home Financials are based on the most recent Mortgage that was taken out on this home.
Original Mortgage
$176,000
Interest Rate
5.97%
Purchase Details
Closed on
Dec 31, 2002
Sold by
Garanian Yervant
Bought by
Garanian Carolyn
Home Financials for this Owner
Home Financials are based on the most recent Mortgage that was taken out on this home.
Original Mortgage
$176,000
Interest Rate
5.97%
Purchase Details
Closed on
Dec 19, 2000
Sold by
Hampton Howard W and Hampton Virginia P
Bought by
Hampton Howard W
Create a Home Valuation Report for This Property
The Home Valuation Report is an in-depth analysis detailing your home's value as well as a comparison with similar homes in the area
Home Values in the Area
Average Home Value in this Area
Purchase History
| Date | Buyer | Sale Price | Title Company |
|---|---|---|---|
| Garanian Carolyn | -- | None Available | |
| Garanian Carolyn | $256,000 | Old Republic Title Company | |
| Garanian Carolyn | -- | Old Republic Title Company | |
| Hampton Howard W | -- | -- |
Source: Public Records
Mortgage History
| Date | Status | Borrower | Loan Amount |
|---|---|---|---|
| Previous Owner | Garanian Carolyn | $176,000 |
Source: Public Records
Tax History Compared to Growth
Tax History
| Year | Tax Paid | Tax Assessment Tax Assessment Total Assessment is a certain percentage of the fair market value that is determined by local assessors to be the total taxable value of land and additions on the property. | Land | Improvement |
|---|---|---|---|---|
| 2025 | $4,074 | $371,143 | $238,966 | $132,177 |
| 2024 | $4,074 | $363,867 | $234,281 | $129,586 |
| 2023 | $3,986 | $356,734 | $229,688 | $127,046 |
| 2022 | $3,918 | $349,740 | $225,185 | $124,555 |
| 2021 | $3,866 | $342,883 | $220,770 | $122,113 |
| 2020 | $3,813 | $339,368 | $218,507 | $120,861 |
| 2019 | $3,714 | $332,715 | $214,223 | $118,492 |
| 2018 | $3,608 | $326,192 | $210,023 | $116,169 |
| 2017 | $3,511 | $319,797 | $205,905 | $113,892 |
| 2016 | $3,437 | $313,527 | $201,868 | $111,659 |
| 2015 | $3,386 | $308,818 | $198,836 | $109,982 |
| 2014 | $3,305 | $302,770 | $194,942 | $107,828 |
Source: Public Records
Map
Nearby Homes
- 16846 Dominican Dr Unit 4
- 16799 Acena Dr
- 16731 Acena Dr
- 11941 Callado Rd
- 16866 Acebo Dr
- 16924 Bellota Dr
- 12085 Calle de Maria
- 12209 Casero Place
- 12215 Santiago Rd W Unit Santiago
- 16734 Bernardo Oaks Dr
- 12093 Callado Rd
- 12195 San Tomas Place
- 12093 Caminito Campana
- 11984 Rancho Bernardo Rd Unit J
- 12094 Caminito Campana
- 16430 Avenida Venusto Unit D
- 12215 Rios Rd
- 17071 Bernardo Center Dr Unit A
- 12047 Avenida Consentido
- 16421 Ramada Dr
- 16780 Diego Dr
- 16798 Diego Dr
- 16827 Acena Dr
- 11974 Obispo Rd
- 11984 Obispo Rd
- 16837 Acena Dr
- 11994 Obispo Rd
- 16808 Bellota Dr
- 11964 Obispo Rd
- 16789 Diego Dr
- 11980 Obispo Rd
- 16817 Acena Dr
- 16847 Acena Dr
- 16779 Diego Dr
- 11954 Obispo Rd
- 16818 Bellota Dr
- 16769 Diego Dr
- 16816 Dominican Dr
- 16857 Acena Dr
- 11981 Obispo Rd