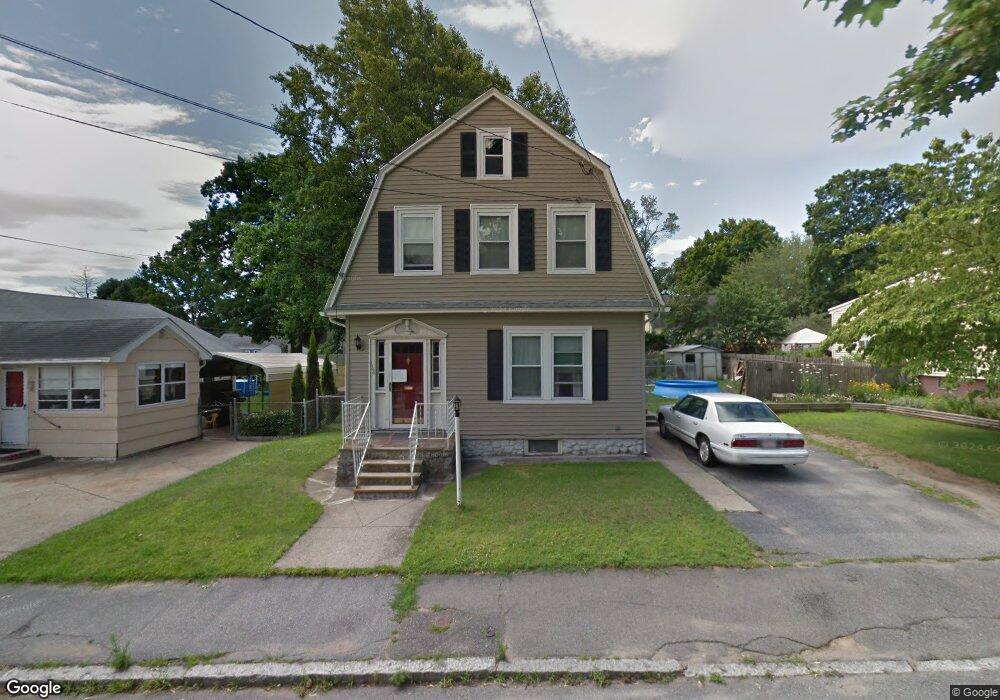
168 A St Lowell, MA 01851
Lower Highlands NeighborhoodEstimated Value: $547,341 - $640,000
4
Beds
2
Baths
1,936
Sq Ft
$297/Sq Ft
Est. Value
About This Home
This home is located at 168 A St, Lowell, MA 01851 and is currently estimated at $574,835, approximately $296 per square foot. 168 A St is a home located in Middlesex County with nearby schools including Abraham Lincoln Elementary School, Charles W. Morey Elementary School, and Dr. Gertrude Bailey Elementary School.
Ownership History
Date
Name
Owned For
Owner Type
Purchase Details
Closed on
Nov 10, 2008
Sold by
Mulrey David G
Bought by
Mulrey David G and Lavoie Lynn E
Current Estimated Value
Purchase Details
Closed on
Jul 14, 2006
Sold by
Lavoie Lynn E and Mcelvin Renate H
Bought by
Mulrey David G
Home Financials for this Owner
Home Financials are based on the most recent Mortgage that was taken out on this home.
Original Mortgage
$230,860
Interest Rate
6.71%
Mortgage Type
Purchase Money Mortgage
Purchase Details
Closed on
Aug 17, 1993
Sold by
Woodbury David and Woodbury Donna M
Bought by
Lavoie Lyn and Mc Elvin Renate
Home Financials for this Owner
Home Financials are based on the most recent Mortgage that was taken out on this home.
Original Mortgage
$105,450
Interest Rate
7.16%
Mortgage Type
Purchase Money Mortgage
Create a Home Valuation Report for This Property
The Home Valuation Report is an in-depth analysis detailing your home's value as well as a comparison with similar homes in the area
Home Values in the Area
Average Home Value in this Area
Purchase History
| Date | Buyer | Sale Price | Title Company |
|---|---|---|---|
| Mulrey David G | -- | -- | |
| Mulrey David G | -- | -- | |
| Mulrey David G | $238,000 | -- | |
| Mulrey David G | $238,000 | -- | |
| Lavoie Lyn | $111,000 | -- | |
| Lavoie Lyn | $111,000 | -- |
Source: Public Records
Mortgage History
| Date | Status | Borrower | Loan Amount |
|---|---|---|---|
| Previous Owner | Mulrey David G | $230,860 | |
| Previous Owner | Lavoie Lyn | $10,000 | |
| Previous Owner | Lavoie Lyn | $105,450 |
Source: Public Records
Tax History
| Year | Tax Paid | Tax Assessment Tax Assessment Total Assessment is a certain percentage of the fair market value that is determined by local assessors to be the total taxable value of land and additions on the property. | Land | Improvement |
|---|---|---|---|---|
| 2025 | $5,560 | $484,300 | $166,300 | $318,000 |
| 2024 | $5,357 | $449,800 | $149,600 | $300,200 |
| 2023 | $5,047 | $406,400 | $130,100 | $276,300 |
| 2022 | $4,763 | $375,300 | $118,300 | $257,000 |
| 2021 | $4,444 | $330,200 | $102,900 | $227,300 |
| 2020 | $4,087 | $305,900 | $89,900 | $216,000 |
| 2019 | $3,883 | $276,600 | $83,300 | $193,300 |
| 2018 | $3,747 | $260,400 | $75,800 | $184,600 |
| 2017 | $3,590 | $240,600 | $68,900 | $171,700 |
| 2016 | $3,378 | $222,800 | $65,600 | $157,200 |
| 2015 | $3,291 | $212,600 | $67,200 | $145,400 |
| 2013 | $3,115 | $207,500 | $80,300 | $127,200 |
Source: Public Records
Map
Nearby Homes
- 85 B St
- 710 School St
- 186 Powell St
- 18 Burgess St
- 525 Chelmsford St
- 108 Inland St
- 11 Warwick St Unit 3
- 137 Pine St Unit 11
- 15 Barclay St
- 37 Saint Paul St
- 17 Edson St
- 142 Sanders Ave
- 68 Smith St
- 3 Butman Place
- 312 Wilder St
- 84 Cambridge St
- 138 W Forest St
- 143 Westford St
- 173 Princeton Blvd
- 42 Branch St
Your Personal Tour Guide
Ask me questions while you tour the home.