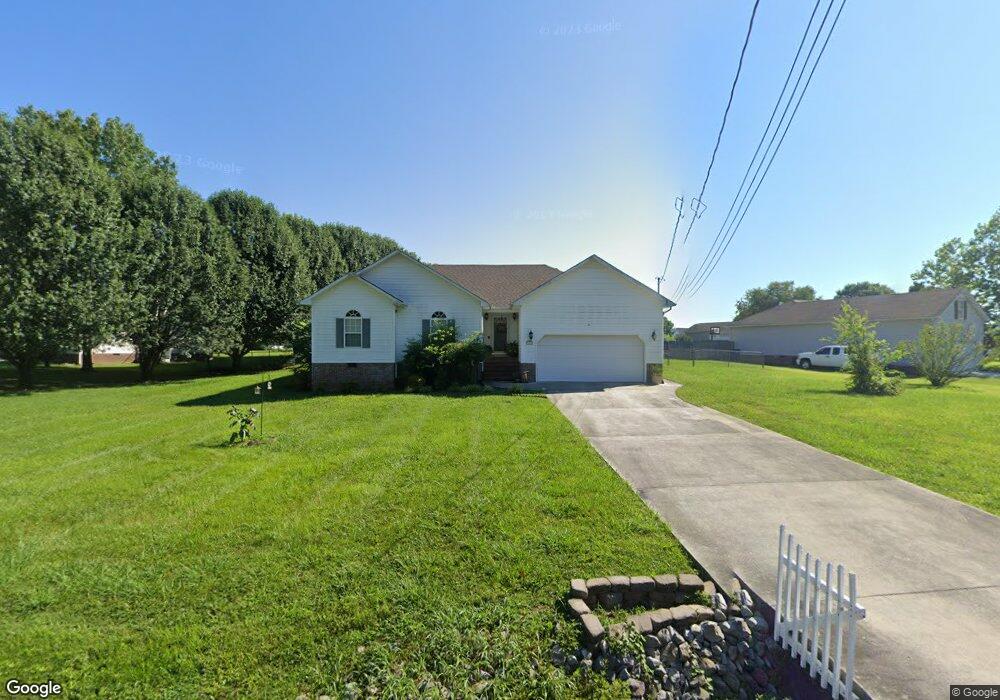
168 Boone Dr Manchester, TN 37355
Estimated Value: $250,766 - $335,000
--
Bed
2
Baths
1,466
Sq Ft
$205/Sq Ft
Est. Value
About This Home
This home is located at 168 Boone Dr, Manchester, TN 37355 and is currently estimated at $300,192, approximately $204 per square foot. 168 Boone Dr is a home located in Coffee County with nearby schools including New Union Elementary School, Coffee County Middle School, and Coffee County Central High School.
Ownership History
Date
Name
Owned For
Owner Type
Purchase Details
Closed on
Feb 21, 2020
Sold by
Jean Boisseau Sheila and Jean Anne Mcmanus
Bought by
Jean Boisseau Sheila
Current Estimated Value
Purchase Details
Closed on
Oct 29, 2009
Sold by
Ratleph Herbert Michael
Bought by
Mcmanus Dorothy A
Purchase Details
Closed on
Apr 5, 2005
Sold by
Ratleph Herbert M
Bought by
Ratleph Herbert Michael
Purchase Details
Closed on
Dec 2, 2004
Sold by
Freeze Ronnie
Bought by
Dunn Giles A
Purchase Details
Closed on
Jul 7, 2000
Sold by
Adams Dewey and Adams Eva
Bought by
Ratleph Herbert M and Ratleph Pamela
Home Financials for this Owner
Home Financials are based on the most recent Mortgage that was taken out on this home.
Original Mortgage
$95,711
Interest Rate
8.55%
Purchase Details
Closed on
Feb 17, 2000
Sold by
Powers Daniel
Bought by
Adams Dewey and Adams Eva
Create a Home Valuation Report for This Property
The Home Valuation Report is an in-depth analysis detailing your home's value as well as a comparison with similar homes in the area
Home Values in the Area
Average Home Value in this Area
Purchase History
| Date | Buyer | Sale Price | Title Company |
|---|---|---|---|
| Jean Boisseau Sheila | -- | None Available | |
| Mcmanus Dorothy A | $116,900 | -- | |
| Ratleph Herbert Michael | -- | -- | |
| Dunn Giles A | $198,900 | -- | |
| Ratleph Herbert M | $96,500 | -- | |
| Adams Dewey | $9,500 | -- |
Source: Public Records
Mortgage History
| Date | Status | Borrower | Loan Amount |
|---|---|---|---|
| Previous Owner | Adams Dewey | $95,711 |
Source: Public Records
Tax History Compared to Growth
Tax History
| Year | Tax Paid | Tax Assessment Tax Assessment Total Assessment is a certain percentage of the fair market value that is determined by local assessors to be the total taxable value of land and additions on the property. | Land | Improvement |
|---|---|---|---|---|
| 2024 | $976 | $43,375 | $5,000 | $38,375 |
| 2023 | $976 | $43,375 | $0 | $0 |
| 2022 | $976 | $43,375 | $5,000 | $38,375 |
| 2021 | $976 | $33,300 | $3,750 | $29,550 |
| 2020 | $976 | $33,300 | $3,750 | $29,550 |
| 2019 | $976 | $33,300 | $3,750 | $29,550 |
| 2018 | $976 | $33,300 | $3,750 | $29,550 |
| 2017 | $1,042 | $31,925 | $3,750 | $28,175 |
| 2016 | $1,042 | $31,925 | $3,750 | $28,175 |
| 2015 | $1,042 | $31,925 | $3,750 | $28,175 |
| 2014 | $1,042 | $31,921 | $0 | $0 |
Source: Public Records
Map
Nearby Homes
- 67 Eldon Dr
- 239 Executive Ct
- 106 Rigney Rd
- 220 Winton Way Rd
- 315 New Union Heights
- 493 Maple Springs Rd
- 481 Matts Hollow Rd
- 2262 Woodbury Hwy
- 621 Brandon Rd
- 417 Whispering Winds Dr
- 14 Avery Ct
- 0 Seminole Ln
- 1579 Woodbury Hwy
- 650 Parker Rd
- 0 Fredonia Rd Unit RTC3043164
- 0 Fredonia Rd Unit RTC2945295
- 603 Gilley Cir
- 362 Lakeview St
- 3249 Fredonia Rd
- 6 Fredonia Rd