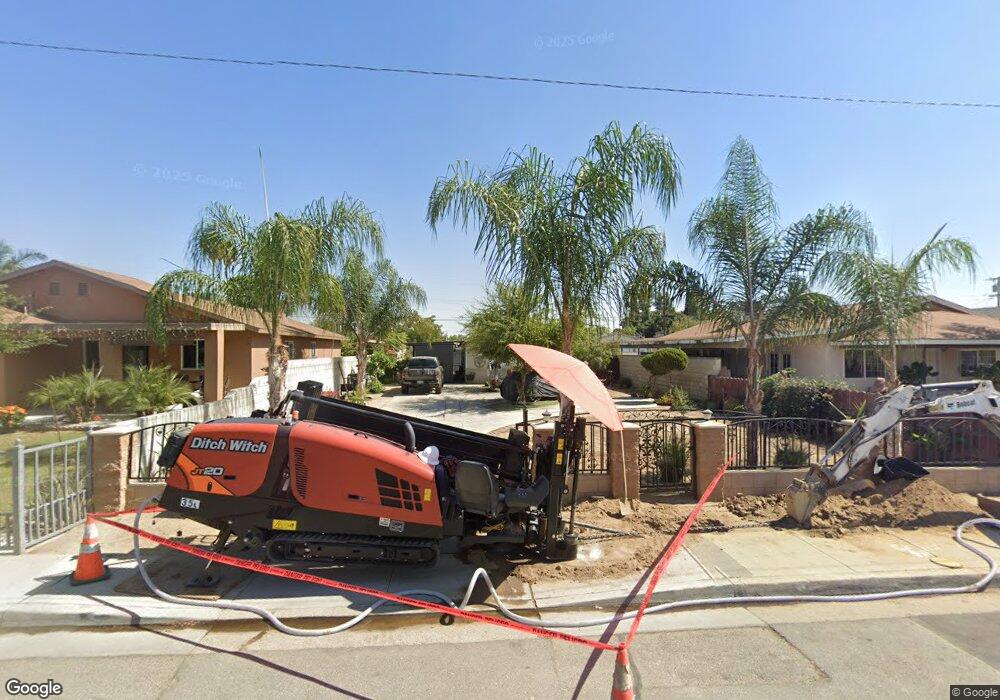
168 Browning Rd Mc Farland, CA 93250
Estimated Value: $236,000 - $284,352
4
Beds
2
Baths
1,196
Sq Ft
$218/Sq Ft
Est. Value
About This Home
This home is located at 168 Browning Rd, Mc Farland, CA 93250 and is currently estimated at $261,088, approximately $218 per square foot. 168 Browning Rd is a home located in Kern County with nearby schools including McFarland High School.
Ownership History
Date
Name
Owned For
Owner Type
Purchase Details
Closed on
Dec 14, 2016
Sold by
Caribbean Properties
Bought by
Rodriguez Covarrubias Pedro Antonio Solian and Rodriguez Velazquez Angelita
Current Estimated Value
Home Financials for this Owner
Home Financials are based on the most recent Mortgage that was taken out on this home.
Original Mortgage
$130,465
Outstanding Balance
$105,510
Interest Rate
3.57%
Mortgage Type
New Conventional
Estimated Equity
$155,578
Purchase Details
Closed on
Jul 28, 2016
Sold by
Garza Zoila Issel Rivera
Bought by
Caribbean Properties
Purchase Details
Closed on
Jun 16, 2009
Sold by
Martinez Hortencia
Bought by
Garza Francisco J
Purchase Details
Closed on
Jan 28, 1997
Sold by
Garza Manuel T and Garza Hortencia
Bought by
Martinez Hortencia
Create a Home Valuation Report for This Property
The Home Valuation Report is an in-depth analysis detailing your home's value as well as a comparison with similar homes in the area
Home Values in the Area
Average Home Value in this Area
Purchase History
| Date | Buyer | Sale Price | Title Company |
|---|---|---|---|
| Rodriguez Covarrubias Pedro Antonio Solian | $134,500 | Chicago Title Company | |
| Caribbean Properties | $66,000 | Chicago Title Company | |
| Garza Francisco J | -- | None Available | |
| Martinez Hortencia | -- | -- |
Source: Public Records
Mortgage History
| Date | Status | Borrower | Loan Amount |
|---|---|---|---|
| Open | Rodriguez Covarrubias Pedro Antonio Solian | $130,465 |
Source: Public Records
Tax History
| Year | Tax Paid | Tax Assessment Tax Assessment Total Assessment is a certain percentage of the fair market value that is determined by local assessors to be the total taxable value of land and additions on the property. | Land | Improvement |
|---|---|---|---|---|
| 2025 | $1,877 | $156,091 | $34,815 | $121,276 |
| 2024 | $1,845 | $153,032 | $34,133 | $118,899 |
| 2023 | $1,845 | $150,032 | $33,464 | $116,568 |
| 2022 | $1,800 | $147,091 | $32,808 | $114,283 |
| 2021 | $1,725 | $144,208 | $32,165 | $112,043 |
| 2020 | $1,669 | $142,731 | $31,836 | $110,895 |
| 2019 | $1,573 | $142,731 | $31,836 | $110,895 |
| 2018 | $1,552 | $137,190 | $30,600 | $106,590 |
| 2017 | $1,511 | $134,500 | $30,000 | $104,500 |
| 2016 | $1,100 | $90,283 | $32,632 | $57,651 |
| 2015 | $1,081 | $88,928 | $32,142 | $56,786 |
| 2014 | $1,036 | $87,187 | $31,513 | $55,674 |
Source: Public Records
Map
Nearby Homes
- 216 Browning Rd
- 148 San Lucas St
- 276 San Juan St
- 254 E Sherwood Ave
- 0 E Sherwood Ave
- 249 Robertson Ave
- 124 4th Place
- 0 W Sherwood Ave Unit 202506495
- 0 W Sherwood Ave Unit 21453658
- 749 Browning Rd
- 805 Price St
- 830 Davis Ave
- 314 8th St
- 617 7th St
- 836 Fletcher St
- 852 Butte St
- 737 Concord Ct
- 714 Hayden Ave
- 737 Misty Ave
- 583 Taylor Ave
- 172 Browning Rd
- 164 Browning Rd
- 188 Browning Rd
- 156 Browning Rd
- 165 San Lucas St Unit 1 & 2
- 165 San Lucas St
- 157 San Lucas St
- 181 San Lucas St
- 149 San Lucas St
- 189 San Lucas St
- 161 Browning Rd
- 140 Browning Rd
- 175 Browning Rd
- 157 Browning Rd
- 189 Browning Rd
- 141 San Lucas St
- 149 Browning Rd
- 141 Browning Rd
- 132 Browning Rd
- 133 San Lucas St
Your Personal Tour Guide
Ask me questions while you tour the home.