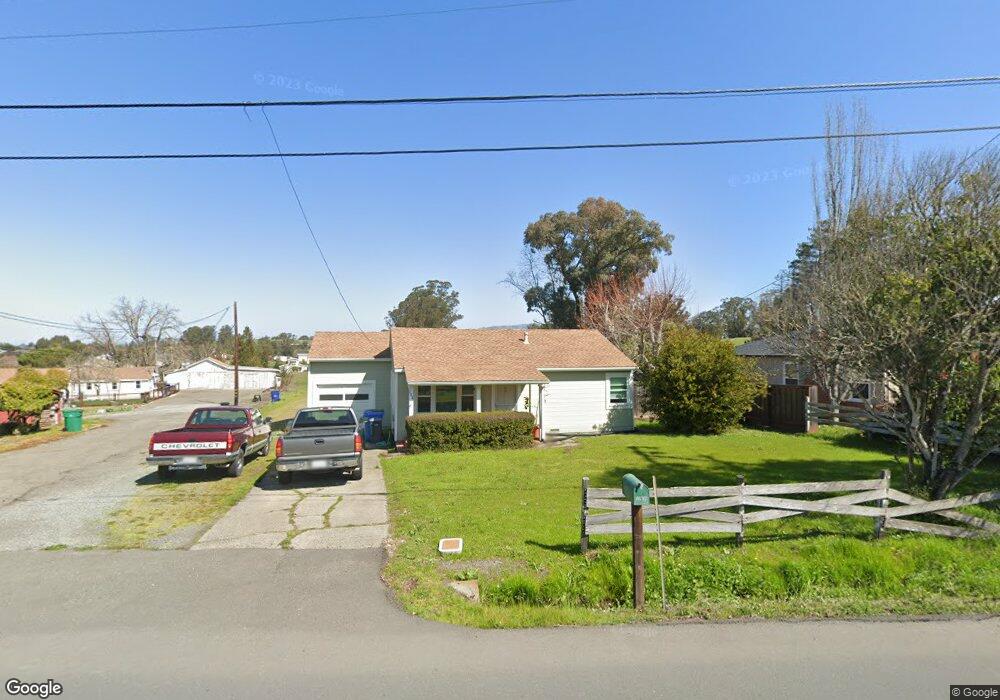
168 Cleveland Ln Petaluma, CA 94952
Estimated Value: $778,000 - $1,082,839
2
Beds
1
Bath
1,632
Sq Ft
$581/Sq Ft
Est. Value
About This Home
This home is located at 168 Cleveland Ln, Petaluma, CA 94952 and is currently estimated at $947,460, approximately $580 per square foot. 168 Cleveland Ln is a home located in Sonoma County with nearby schools including Wilson Elementary School, Petaluma Junior High School, and Petaluma High School.
Ownership History
Date
Name
Owned For
Owner Type
Purchase Details
Closed on
Jan 4, 2018
Sold by
Loeffiler Peter C and Loeffiler Laura J
Bought by
Rafferley Mciahel Frnics
Current Estimated Value
Home Financials for this Owner
Home Financials are based on the most recent Mortgage that was taken out on this home.
Original Mortgage
$300,000
Outstanding Balance
$253,164
Interest Rate
3.94%
Mortgage Type
New Conventional
Estimated Equity
$694,296
Purchase Details
Closed on
Dec 10, 1999
Sold by
Loeffler Peter C and Loeffler Laura J
Bought by
Loeffler Peter C and Loeffler Laura J
Home Financials for this Owner
Home Financials are based on the most recent Mortgage that was taken out on this home.
Original Mortgage
$132,000
Interest Rate
7.82%
Mortgage Type
Stand Alone First
Purchase Details
Closed on
Mar 21, 1995
Sold by
Knight Laura J
Bought by
Loeffler Peter C and Loeffler Laura J
Create a Home Valuation Report for This Property
The Home Valuation Report is an in-depth analysis detailing your home's value as well as a comparison with similar homes in the area
Home Values in the Area
Average Home Value in this Area
Purchase History
| Date | Buyer | Sale Price | Title Company |
|---|---|---|---|
| Rafferley Mciahel Frnics | $600,000 | First American Title Co | |
| Loeffler Peter C | -- | Old Republic Title Company | |
| Loeffler Peter C | -- | Old Republic Title Company | |
| Loeffler Peter C | -- | -- |
Source: Public Records
Mortgage History
| Date | Status | Borrower | Loan Amount |
|---|---|---|---|
| Open | Rafferley Mciahel Frnics | $300,000 | |
| Previous Owner | Loeffler Peter C | $132,000 |
Source: Public Records
Tax History Compared to Growth
Tax History
| Year | Tax Paid | Tax Assessment Tax Assessment Total Assessment is a certain percentage of the fair market value that is determined by local assessors to be the total taxable value of land and additions on the property. | Land | Improvement |
|---|---|---|---|---|
| 2025 | $8,394 | $750,963 | $449,440 | $301,523 |
| 2024 | $8,394 | $736,239 | $440,628 | $295,611 |
| 2023 | $8,394 | $721,804 | $431,989 | $289,815 |
| 2022 | $7,967 | $707,652 | $423,519 | $284,133 |
| 2021 | $7,819 | $693,777 | $415,215 | $278,562 |
| 2020 | $7,886 | $686,664 | $410,958 | $275,706 |
| 2019 | $7,790 | $673,200 | $402,900 | $270,300 |
| 2018 | $3,210 | $260,462 | $148,762 | $111,700 |
| 2017 | $3,146 | $255,356 | $145,846 | $109,510 |
| 2016 | $3,070 | $250,350 | $142,987 | $107,363 |
| 2015 | -- | $246,591 | $140,840 | $105,751 |
| 2014 | -- | $241,762 | $138,082 | $103,680 |
Source: Public Records
Map
Nearby Homes
- 8 Cleveland Ln
- 172 Cleveland Ln
- 6 Cleveland Ln
- 15 Cleveland Ln
- 176 Cleveland Ln
- 2000 Western Ave
- 17 Cleveland Ln
- 184 Cleveland Ln
- 1850 Western Ave
- 99 Cleveland Ln
- 220 Cleveland Ln
- 228 Cleveland Ln
- 2008 Western Ave
- 177 Cleveland Ln
- 236 Cleveland Ln
- 2001 Western Ave
- 2003 Western Ave
- 1991 Western Ave
- 1774 Western Ave
- 1981 Western Ave