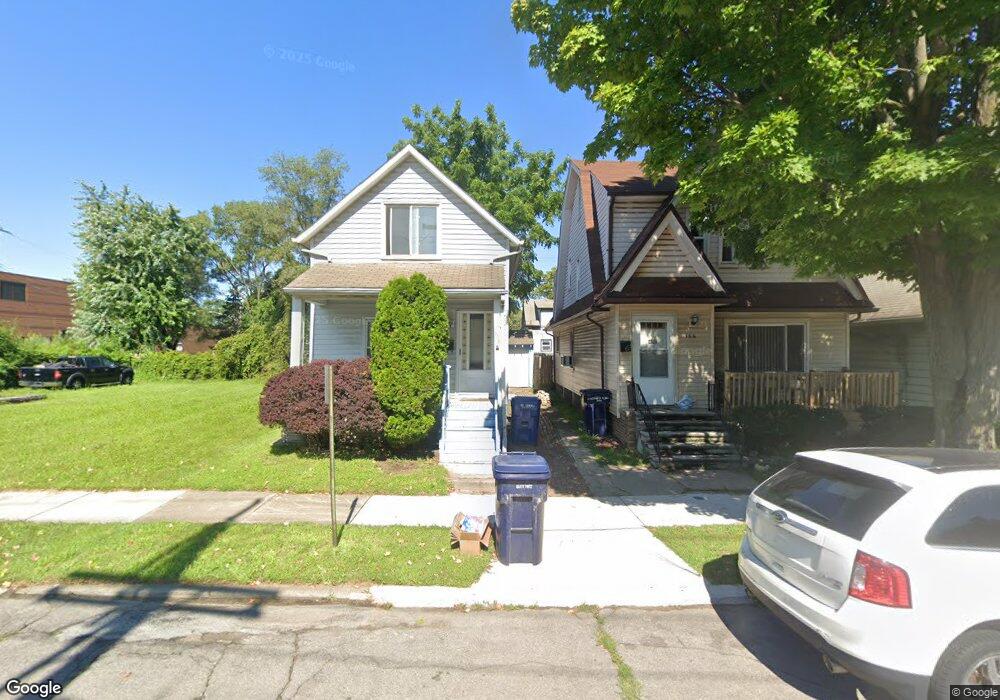
168 Division St Unit Bldg-Unit River Rouge, MI 48218
Estimated Value: $56,217 - $76,000
--
Bed
1
Bath
768
Sq Ft
$84/Sq Ft
Est. Value
About This Home
This home is located at 168 Division St Unit Bldg-Unit, River Rouge, MI 48218 and is currently estimated at $64,304, approximately $83 per square foot. 168 Division St Unit Bldg-Unit is a home located in Wayne County with nearby schools including Ann Visger K-5 Preparatory Academy.
Ownership History
Date
Name
Owned For
Owner Type
Purchase Details
Closed on
Jun 3, 2021
Sold by
Suchini Jacobo Leiva
Bought by
Wilson Khari
Current Estimated Value
Purchase Details
Closed on
May 14, 2021
Sold by
Dalessio Gina and Suchini Jacobo Leiva
Bought by
Suchini Jacobo Leiva
Purchase Details
Closed on
Jun 8, 2018
Sold by
Suchini Jacobo Leiva
Bought by
Dalessio Gina
Purchase Details
Closed on
Mar 12, 2017
Sold by
Arie Daniel Gur
Bought by
Suchini Jaconbo Leiva
Purchase Details
Closed on
Nov 11, 2014
Sold by
Treasurer Of The Charter County Of Wayne
Bought by
Arie Daniel Gur
Purchase Details
Closed on
Mar 31, 2009
Sold by
Secretary Of Housing & Urban Development
Bought by
Bowman Timothy
Purchase Details
Closed on
Sep 7, 2007
Sold by
Michigan State Housing Development Autho
Bought by
Hud
Purchase Details
Closed on
Jan 17, 2007
Sold by
Straight Carol R
Bought by
Michigan State Housing Development Autho
Create a Home Valuation Report for This Property
The Home Valuation Report is an in-depth analysis detailing your home's value as well as a comparison with similar homes in the area
Home Values in the Area
Average Home Value in this Area
Purchase History
| Date | Buyer | Sale Price | Title Company |
|---|---|---|---|
| Wilson Khari | $29,900 | None Available | |
| Suchini Jacobo Leiva | -- | None Available | |
| Dalessio Gina | -- | None Available | |
| Suchini Jaconbo Leiva | $2,800 | None Available | |
| Arie Daniel Gur | $1,200 | None Available | |
| Bowman Timothy | $500 | None Available | |
| Hud | -- | None Available | |
| Michigan State Housing Development Autho | $13,643 | None Available |
Source: Public Records
Tax History Compared to Growth
Tax History
| Year | Tax Paid | Tax Assessment Tax Assessment Total Assessment is a certain percentage of the fair market value that is determined by local assessors to be the total taxable value of land and additions on the property. | Land | Improvement |
|---|---|---|---|---|
| 2025 | $1,000 | $25,500 | $0 | $0 |
| 2024 | $1,000 | $21,900 | $0 | $0 |
| 2023 | $952 | $17,200 | $0 | $0 |
| 2022 | $1,465 | $13,200 | $0 | $0 |
| 2021 | $1,133 | $11,300 | $0 | $0 |
| 2020 | $989 | $9,600 | $0 | $0 |
| 2019 | $605 | $8,600 | $0 | $0 |
| 2018 | $2,874 | $8,300 | $0 | $0 |
| 2017 | $542 | $8,500 | $0 | $0 |
| 2016 | $1,896 | $8,700 | $0 | $0 |
| 2015 | $1,080 | $10,800 | $0 | $0 |
| 2013 | $1,720 | $18,100 | $0 | $0 |
| 2012 | $1,740 | $17,700 | $2,600 | $15,100 |
Source: Public Records
Map
Nearby Homes
- 168 Division St
- 166 Division St
- 160 Division St
- 164 Division St
- 163 Charles St
- 158 Division St
- 170 Division St
- 2149 Myrtle St
- 2211 Myrtle St
- 165 Charles St
- 171 Charles St
- 40 Linden St
- 167 Charles St
- 155 Charles St
- 156 Division St
- 176 Division St
- 35 Myrtle St
- 34 Linden St
- 157 Charles St
- 153 Charles St