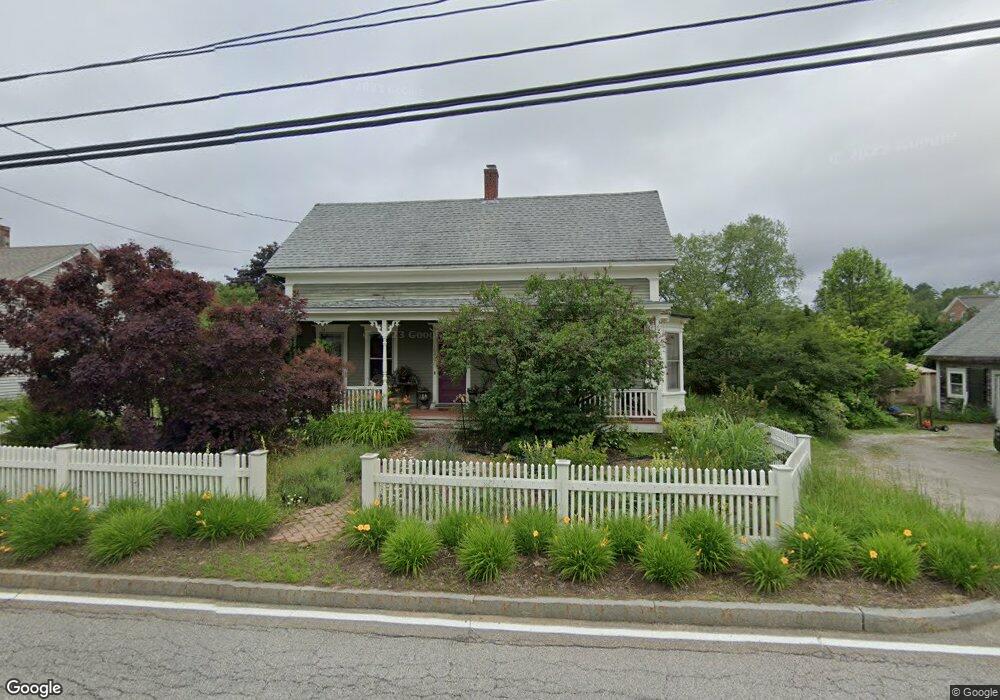
168 Main St Belmont, NH 03220
Estimated Value: $408,000 - $593,000
3
Beds
1
Bath
2,219
Sq Ft
$220/Sq Ft
Est. Value
About This Home
This home is located at 168 Main St, Belmont, NH 03220 and is currently estimated at $487,403, approximately $219 per square foot. 168 Main St is a home with nearby schools including Belmont Elementary School, Belmont Middle School, and Belmont High School.
Ownership History
Date
Name
Owned For
Owner Type
Purchase Details
Closed on
Jun 25, 2002
Sold by
Stockwell Frances
Bought by
Cygan Douglas W and Cygan Heather Ouellet
Current Estimated Value
Home Financials for this Owner
Home Financials are based on the most recent Mortgage that was taken out on this home.
Original Mortgage
$126,400
Outstanding Balance
$53,963
Interest Rate
6.81%
Estimated Equity
$433,440
Purchase Details
Closed on
Mar 1, 1999
Sold by
Appleby Earl E and Madeleine Appleby M
Bought by
Stockwell Frances
Home Financials for this Owner
Home Financials are based on the most recent Mortgage that was taken out on this home.
Original Mortgage
$35,000
Interest Rate
6.78%
Create a Home Valuation Report for This Property
The Home Valuation Report is an in-depth analysis detailing your home's value as well as a comparison with similar homes in the area
Home Values in the Area
Average Home Value in this Area
Purchase History
| Date | Buyer | Sale Price | Title Company |
|---|---|---|---|
| Cygan Douglas W | $158,000 | -- | |
| Stockwell Frances | $54,000 | -- |
Source: Public Records
Mortgage History
| Date | Status | Borrower | Loan Amount |
|---|---|---|---|
| Open | Stockwell Frances | $126,400 | |
| Previous Owner | Stockwell Frances | $35,000 |
Source: Public Records
Tax History Compared to Growth
Tax History
| Year | Tax Paid | Tax Assessment Tax Assessment Total Assessment is a certain percentage of the fair market value that is determined by local assessors to be the total taxable value of land and additions on the property. | Land | Improvement |
|---|---|---|---|---|
| 2024 | $6,562 | $416,900 | $68,600 | $348,300 |
| 2023 | $5,969 | $341,700 | $54,000 | $287,700 |
| 2022 | $6,207 | $324,800 | $46,900 | $277,900 |
| 2021 | $5,939 | $222,700 | $29,700 | $193,000 |
| 2020 | $5,643 | $222,700 | $29,700 | $193,000 |
| 2019 | $5,570 | $222,700 | $29,700 | $193,000 |
| 2017 | $5,960 | $202,300 | $41,900 | $160,400 |
| 2016 | $5,832 | $202,300 | $41,900 | $160,400 |
| 2015 | $5,719 | $202,300 | $41,900 | $160,400 |
| 2014 | $5,594 | $202,300 | $41,900 | $160,400 |
| 2013 | $5,531 | $246,500 | $72,400 | $174,100 |
Source: Public Records
Map
Nearby Homes