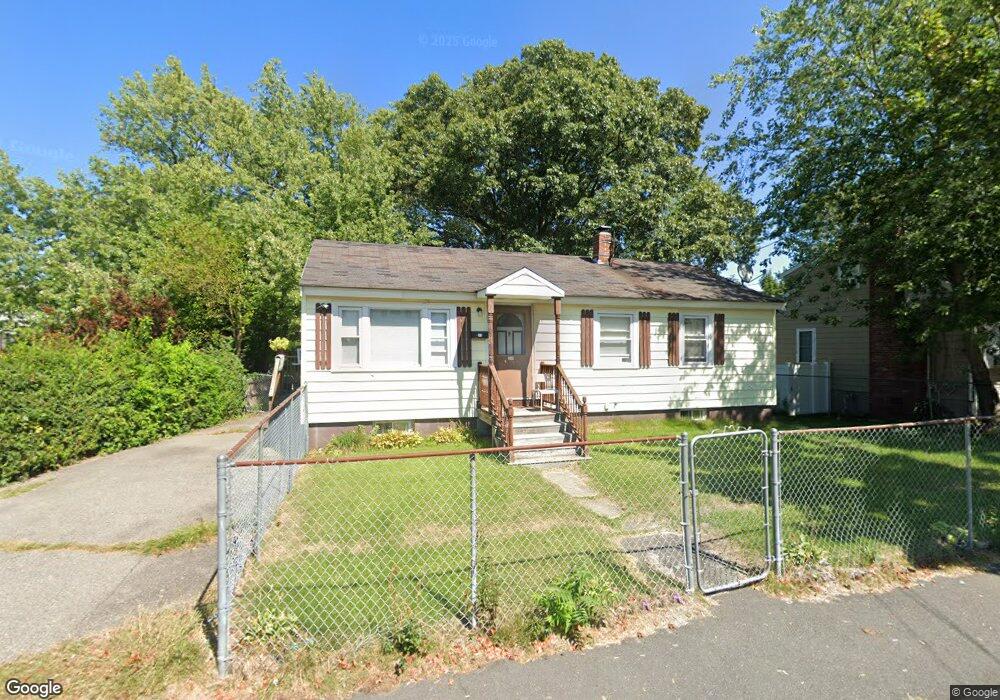
168 Main St Unit 168 Quincy, MA 02169
Quincy Point NeighborhoodEstimated Value: $500,000 - $646,000
3
Beds
1
Bath
1,000
Sq Ft
$597/Sq Ft
Est. Value
About This Home
This home is located at 168 Main St Unit 168, Quincy, MA 02169 and is currently estimated at $597,324, approximately $597 per square foot. 168 Main St Unit 168 is a home located in Norfolk County with nearby schools including Point Webster Middle School, Clifford H. Marshall Elementary School, and Quincy High School.
Ownership History
Date
Name
Owned For
Owner Type
Purchase Details
Closed on
Jan 21, 2015
Sold by
Thai Irene O and Thai Hi
Bought by
Kwong Joel C and Kwong Jenny D
Current Estimated Value
Home Financials for this Owner
Home Financials are based on the most recent Mortgage that was taken out on this home.
Original Mortgage
$277,500
Outstanding Balance
$213,490
Interest Rate
3.96%
Mortgage Type
New Conventional
Estimated Equity
$383,834
Purchase Details
Closed on
Sep 19, 2002
Sold by
Hunka Thomas G and Hunka Patricia L
Bought by
Thai Irene O and Thai Hi
Purchase Details
Closed on
Sep 15, 1997
Sold by
Est Christensen John D and Christensen Joyce M
Bought by
Hunka Thomas G and Hunka Patricia L
Home Financials for this Owner
Home Financials are based on the most recent Mortgage that was taken out on this home.
Original Mortgage
$99,200
Interest Rate
7.31%
Mortgage Type
Purchase Money Mortgage
Create a Home Valuation Report for This Property
The Home Valuation Report is an in-depth analysis detailing your home's value as well as a comparison with similar homes in the area
Home Values in the Area
Average Home Value in this Area
Purchase History
| Date | Buyer | Sale Price | Title Company |
|---|---|---|---|
| Kwong Joel C | $370,000 | -- | |
| Thai Irene O | $282,000 | -- | |
| Hunka Thomas G | $124,000 | -- |
Source: Public Records
Mortgage History
| Date | Status | Borrower | Loan Amount |
|---|---|---|---|
| Open | Kwong Joel C | $277,500 | |
| Previous Owner | Hunka Thomas G | $13,000 | |
| Previous Owner | Hunka Thomas G | $99,200 |
Source: Public Records
Tax History Compared to Growth
Tax History
| Year | Tax Paid | Tax Assessment Tax Assessment Total Assessment is a certain percentage of the fair market value that is determined by local assessors to be the total taxable value of land and additions on the property. | Land | Improvement |
|---|---|---|---|---|
| 2025 | $6,018 | $521,900 | $324,800 | $197,100 |
| 2024 | $5,696 | $505,400 | $310,100 | $195,300 |
| 2023 | $5,289 | $475,200 | $283,400 | $191,800 |
| 2022 | $5,298 | $442,200 | $259,200 | $183,000 |
| 2021 | $5,172 | $426,000 | $259,200 | $166,800 |
| 2020 | $4,864 | $391,300 | $245,400 | $145,900 |
| 2019 | $4,679 | $372,800 | $228,400 | $144,400 |
| 2018 | $4,500 | $337,300 | $209,200 | $128,100 |
| 2017 | $4,439 | $313,300 | $200,000 | $113,300 |
| 2016 | $4,179 | $291,000 | $183,300 | $107,700 |
| 2015 | $4,043 | $276,900 | $173,800 | $103,100 |
| 2014 | $3,968 | $267,000 | $173,800 | $93,200 |
Source: Public Records
Map
Nearby Homes
- 19 Keyes St
- 51 Sumner St
- 25 5th Ave
- 32 Sumner St
- 16 Dartmouth St Unit 16
- 161 Sumner St Unit 2
- 161 Sumner St Unit 4
- 16 Perley Place
- 934 Southern Artery Unit 109
- 313 Washington St
- 41 Broadway
- 200 Falls Blvd Unit B305
- 200 Falls Blvd Unit C308
- 187 Washington St
- 26 Lawrence St
- 585 Washington St Unit model-1
- 585 Washington St Unit model-2
- 585 Washington St Unit model
- 33 Elm St
- 35 Miller Stile Rd