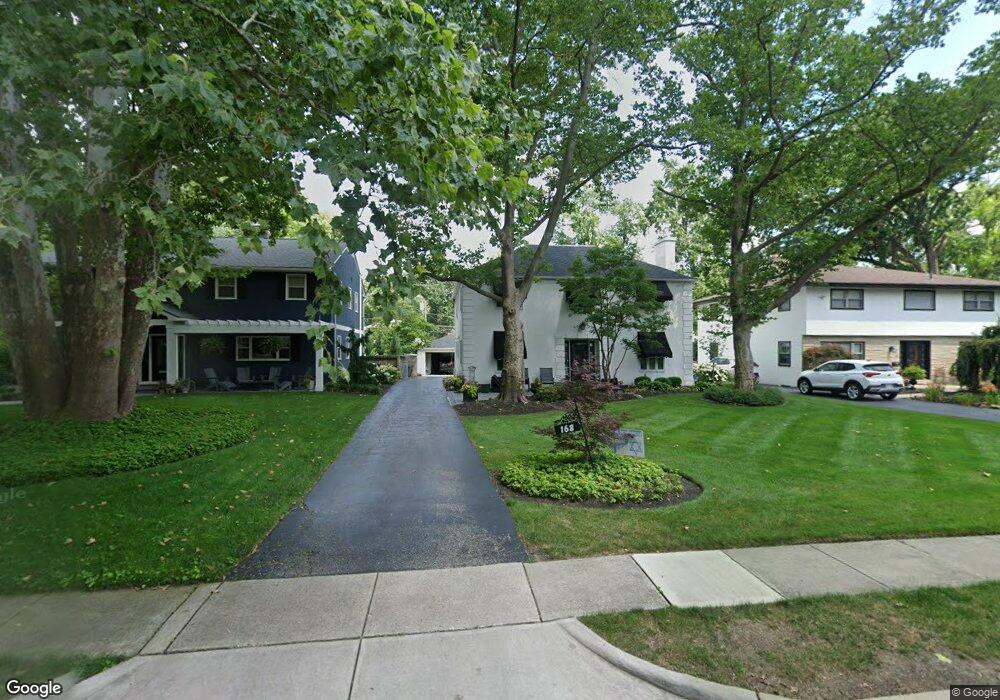
168 S Merkle Rd Columbus, OH 43209
Estimated Value: $736,000 - $829,000
4
Beds
4
Baths
2,660
Sq Ft
$297/Sq Ft
Est. Value
About This Home
This home is located at 168 S Merkle Rd, Columbus, OH 43209 and is currently estimated at $791,082, approximately $297 per square foot. 168 S Merkle Rd is a home with nearby schools including Cassingham Elementary School, Bexley Middle School, and Bexley High School.
Ownership History
Date
Name
Owned For
Owner Type
Purchase Details
Closed on
Aug 28, 2001
Sold by
Sugarman Debbi S
Bought by
Sugarman Debbi S
Current Estimated Value
Home Financials for this Owner
Home Financials are based on the most recent Mortgage that was taken out on this home.
Original Mortgage
$280,000
Interest Rate
6.57%
Mortgage Type
Purchase Money Mortgage
Purchase Details
Closed on
Apr 9, 1998
Sold by
Sugarman Debbi S
Bought by
Sugarman Debbi S
Home Financials for this Owner
Home Financials are based on the most recent Mortgage that was taken out on this home.
Original Mortgage
$128,000
Interest Rate
7.27%
Purchase Details
Closed on
Oct 5, 1994
Sold by
Est Katherine Friedman
Bought by
Debbie S Sugarman Trustee
Home Financials for this Owner
Home Financials are based on the most recent Mortgage that was taken out on this home.
Original Mortgage
$100,000
Interest Rate
8.64%
Mortgage Type
New Conventional
Create a Home Valuation Report for This Property
The Home Valuation Report is an in-depth analysis detailing your home's value as well as a comparison with similar homes in the area
Home Values in the Area
Average Home Value in this Area
Purchase History
| Date | Buyer | Sale Price | Title Company |
|---|---|---|---|
| Sugarman Debbi S | -- | -- | |
| Sugarman Debbi S | -- | Stewart Title Agency | |
| Sugarman Debbi S | -- | Stewart Title Agency | |
| Debbie S Sugarman Trustee | $270,000 | -- |
Source: Public Records
Mortgage History
| Date | Status | Borrower | Loan Amount |
|---|---|---|---|
| Closed | Sugarman Debbi S | $280,000 | |
| Closed | Sugarman Debbi S | $128,000 | |
| Closed | Debbie S Sugarman Trustee | $100,000 |
Source: Public Records
Tax History Compared to Growth
Tax History
| Year | Tax Paid | Tax Assessment Tax Assessment Total Assessment is a certain percentage of the fair market value that is determined by local assessors to be the total taxable value of land and additions on the property. | Land | Improvement |
|---|---|---|---|---|
| 2024 | $11,948 | $215,150 | $83,550 | $131,600 |
| 2023 | $10,742 | $215,145 | $83,545 | $131,600 |
| 2022 | $9,809 | $157,790 | $55,760 | $102,030 |
| 2021 | $9,817 | $157,790 | $55,760 | $102,030 |
| 2020 | $9,731 | $157,790 | $55,760 | $102,030 |
| 2019 | $9,121 | $130,130 | $46,480 | $83,650 |
| 2018 | $8,269 | $130,130 | $46,480 | $83,650 |
| 2017 | $8,161 | $130,130 | $46,480 | $83,650 |
| 2016 | $8,587 | $132,020 | $36,470 | $95,550 |
| 2015 | $8,612 | $132,020 | $36,470 | $95,550 |
| 2014 | $8,662 | $132,020 | $36,470 | $95,550 |
| 2013 | $4,093 | $120,015 | $33,145 | $86,870 |
Source: Public Records
Map
Nearby Homes
- 142 S Gould Rd
- 123 S Gould Rd
- 208 S Stanwood Rd
- 2731 E Broad St
- 2717 E Broad St
- 50 S Chesterfield Rd
- 2738 E Broad St
- 2629 E Broad St
- 50 N Broadleigh Rd
- 47 N Chesterfield Rd
- 49 N Cassingham Rd
- 96 N Cassingham Rd
- 268 S Cassady Ave
- 239 S Kellner Rd
- 2455 Dale Ave
- 277 S James Rd
- 247 S James Rd
- 297 S James Rd
- 205 N Gould Rd
- 430 S James Rd
- 160 S Merkle Rd
- 176 S Merkle Rd
- 184 S Merkle Rd
- 152 S Merkle Rd
- 146 S Merkle Rd
- 177 S Gould Rd
- 165 S Merkle Rd
- 185 S Gould Rd
- 175 S Merkle Rd
- 153 S Merkle Rd
- 138 S Merkle Rd
- 169 S Gould Rd
- 2822 Powell Ave
- 161 S Gould Rd
- 2816 Powell Ave
- 185 S Merkle Rd
- 2834 Powell Ave
- 157 S Gould Rd
- 157 S Gould Rd
- 145 S Merkle Rd