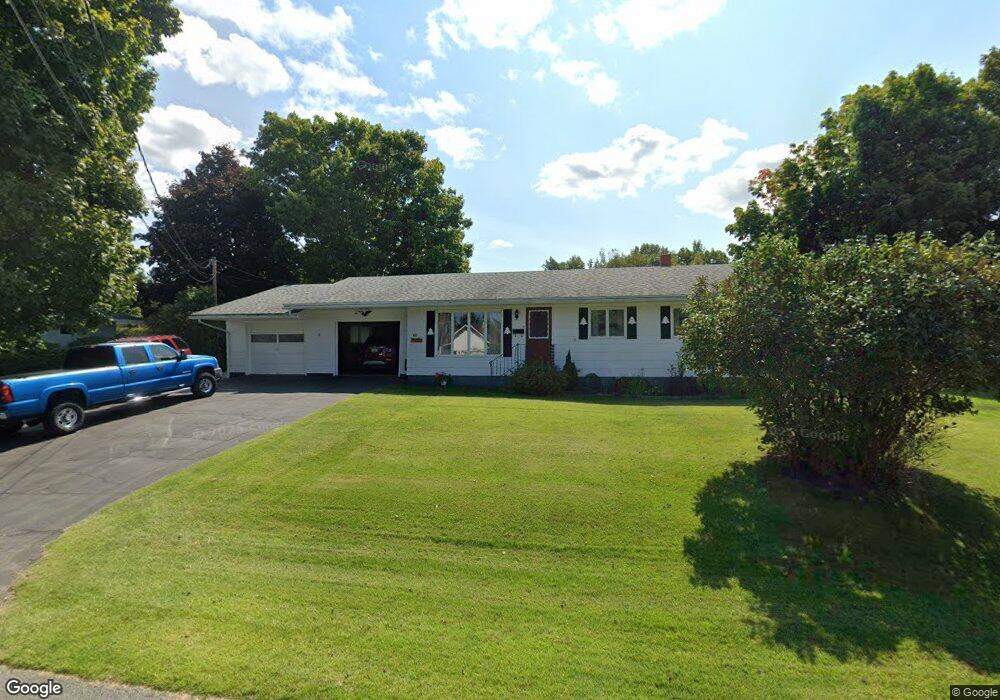
168 Sloan St Newport, VT 05855
Estimated Value: $263,000 - $279,000
3
Beds
2
Baths
1,040
Sq Ft
$260/Sq Ft
Est. Value
About This Home
This home is located at 168 Sloan St, Newport, VT 05855 and is currently estimated at $270,472, approximately $260 per square foot. 168 Sloan St is a home located in Orleans County with nearby schools including Newport City Elementary School, North Country Union Junior High School, and North Country Union High School.
Ownership History
Date
Name
Owned For
Owner Type
Purchase Details
Closed on
Dec 18, 2024
Sold by
Robert James Nevins and Robert Lynne Marie
Bought by
Nevins Christina and Nevins Jennifer M
Current Estimated Value
Purchase Details
Closed on
Oct 31, 2022
Sold by
Patenaude Jessica R and Patenaude Steven R
Bought by
Nevins Trustee Lynne M and Nevins Trustee Robert J
Purchase Details
Closed on
Aug 23, 2022
Sold by
Pouliot Claire A and Pouliot Maurice A
Bought by
Patenaude Jessica R and Patenaude Steven R
Create a Home Valuation Report for This Property
The Home Valuation Report is an in-depth analysis detailing your home's value as well as a comparison with similar homes in the area
Home Values in the Area
Average Home Value in this Area
Purchase History
| Date | Buyer | Sale Price | Title Company |
|---|---|---|---|
| Nevins Christina | -- | -- | |
| Nevins Trustee Lynne M | $239,000 | -- | |
| Nevins Trustee Lynne M | $239,000 | -- | |
| Nevins Trustee Lynne M | $239,000 | -- | |
| Patenaude Jessica R | $179,000 | -- | |
| Patenaude Jessica R | $179,000 | -- | |
| Patenaude Jessica R | $179,000 | -- |
Source: Public Records
Tax History Compared to Growth
Tax History
| Year | Tax Paid | Tax Assessment Tax Assessment Total Assessment is a certain percentage of the fair market value that is determined by local assessors to be the total taxable value of land and additions on the property. | Land | Improvement |
|---|---|---|---|---|
| 2024 | $3,550 | $119,000 | $35,700 | $83,300 |
| 2023 | $3,550 | $119,000 | $35,700 | $83,300 |
| 2022 | $3,550 | $119,000 | $35,700 | $83,300 |
| 2021 | $3,624 | $119,000 | $35,700 | $83,300 |
| 2020 | $3,604 | $119,000 | $35,700 | $83,300 |
| 2019 | $3,501 | $119,000 | $35,700 | $83,300 |
| 2018 | $3,440 | $119,000 | $35,700 | $83,300 |
| 2016 | $2,851 | $95,000 | $21,700 | $73,300 |
Source: Public Records
Map
Nearby Homes