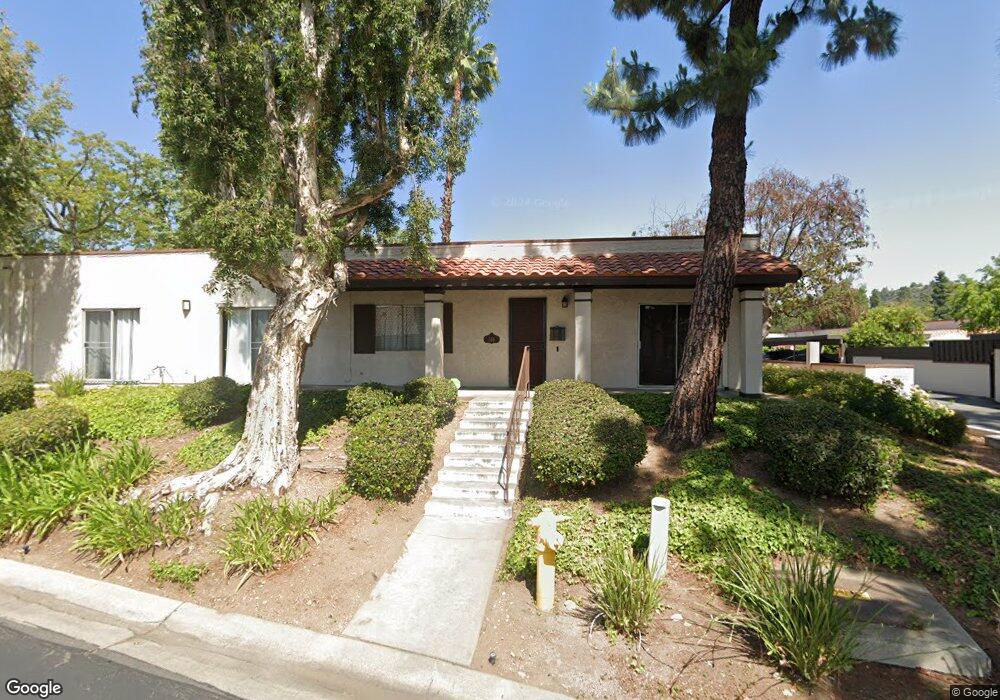
168 W Via Vaquero San Dimas, CA 91773
Estimated Value: $538,000 - $595,000
2
Beds
2
Baths
1,054
Sq Ft
$533/Sq Ft
Est. Value
About This Home
This home is located at 168 W Via Vaquero, San Dimas, CA 91773 and is currently estimated at $561,987, approximately $533 per square foot. 168 W Via Vaquero is a home located in Los Angeles County with nearby schools including Fred Ekstrand Elementary School, Lone Hill Middle School, and San Dimas High School.
Ownership History
Date
Name
Owned For
Owner Type
Purchase Details
Closed on
Jun 23, 2016
Sold by
Moret Denise M
Bought by
Moret Denise M and Denise Moret Living Trust
Current Estimated Value
Purchase Details
Closed on
Jun 26, 2009
Sold by
Hanson Lisa and Mccafferty John Andrew
Bought by
Moret Denise M
Home Financials for this Owner
Home Financials are based on the most recent Mortgage that was taken out on this home.
Original Mortgage
$230,743
Outstanding Balance
$150,598
Interest Rate
5.31%
Mortgage Type
FHA
Estimated Equity
$411,389
Purchase Details
Closed on
Aug 12, 2008
Sold by
Hanson Lisa and Estate Of Marianne Fullerton
Bought by
Hanson Lisa
Purchase Details
Closed on
Dec 1, 1994
Sold by
Federal Home Loan Mortgage Corporation
Bought by
Mccafferty Marianne F
Purchase Details
Closed on
May 18, 1994
Sold by
California Reconveyance Company
Bought by
Federal Home Loan Mortgage Corporation
Create a Home Valuation Report for This Property
The Home Valuation Report is an in-depth analysis detailing your home's value as well as a comparison with similar homes in the area
Home Values in the Area
Average Home Value in this Area
Purchase History
| Date | Buyer | Sale Price | Title Company |
|---|---|---|---|
| Moret Denise M | -- | None Available | |
| Moret Denise M | $235,000 | Provident Title Company | |
| Hanson Lisa | -- | None Available | |
| Mccafferty Marianne F | $94,409 | World Title Company | |
| Federal Home Loan Mortgage Corporation | $109,361 | Chicago Title Company |
Source: Public Records
Mortgage History
| Date | Status | Borrower | Loan Amount |
|---|---|---|---|
| Open | Moret Denise M | $230,743 |
Source: Public Records
Tax History Compared to Growth
Tax History
| Year | Tax Paid | Tax Assessment Tax Assessment Total Assessment is a certain percentage of the fair market value that is determined by local assessors to be the total taxable value of land and additions on the property. | Land | Improvement |
|---|---|---|---|---|
| 2025 | $3,796 | $303,328 | $145,467 | $157,861 |
| 2024 | $3,796 | $297,381 | $142,615 | $154,766 |
| 2023 | $3,710 | $291,551 | $139,819 | $151,732 |
| 2022 | $3,645 | $285,835 | $137,078 | $148,757 |
| 2021 | $3,570 | $280,232 | $134,391 | $145,841 |
| 2019 | $3,494 | $271,921 | $130,405 | $141,516 |
| 2018 | $3,338 | $266,591 | $127,849 | $138,742 |
| 2016 | $3,209 | $256,241 | $122,886 | $133,355 |
| 2015 | $3,159 | $252,393 | $121,041 | $131,352 |
| 2014 | $3,133 | $247,449 | $118,670 | $128,779 |
Source: Public Records
Map
Nearby Homes
- 514 San Pablo Ct
- 404 W Via Vaquero
- 743 Smokewood Ln
- 0 E De Anza Heights Dr
- 730 Briarwood Ln
- 765 Smokewood Ln
- 770 S Tonopah Ct
- 402 E De Anza Heights Dr
- 751 Harwood Ct
- 748 S Walnut Ave
- 141 W 1st St
- 518 Willow Place
- 216 W 3rd St
- 208 E 3rd St
- 801 W Covina Blvd Unit 105
- 801 W Covina Blvd Unit 54
- 208 S Gaffney Ave
- 100 Rawlinsdale Ln
- 0 Dallas Rd Unit WS25141209
- 808 Arbor Cir
- 166 W Via Vaquero
- 170 W Via Vaquero
- 172 W Via Vaquero
- 206 W Via Vaquero
- 208 W Via Vaquero
- 204 W Via Vaquero
- 174 W Via Vaquero
- 158 W Via Vaquero
- 202 W Via Vaquero
- 160 W Via Vaquero
- 162 W Via Vaquero
- 608 Santa Cruz Ct
- 176 W Via Vaquero
- 164 W Via Vaquero
- 200 W Via Vaquero
- 610 Santa Cruz Ct
- 606 Santa Cruz Ct
- 350 W Via Vaquero
- 604 Santa Cruz Ct
- 602 Santa Cruz Ct