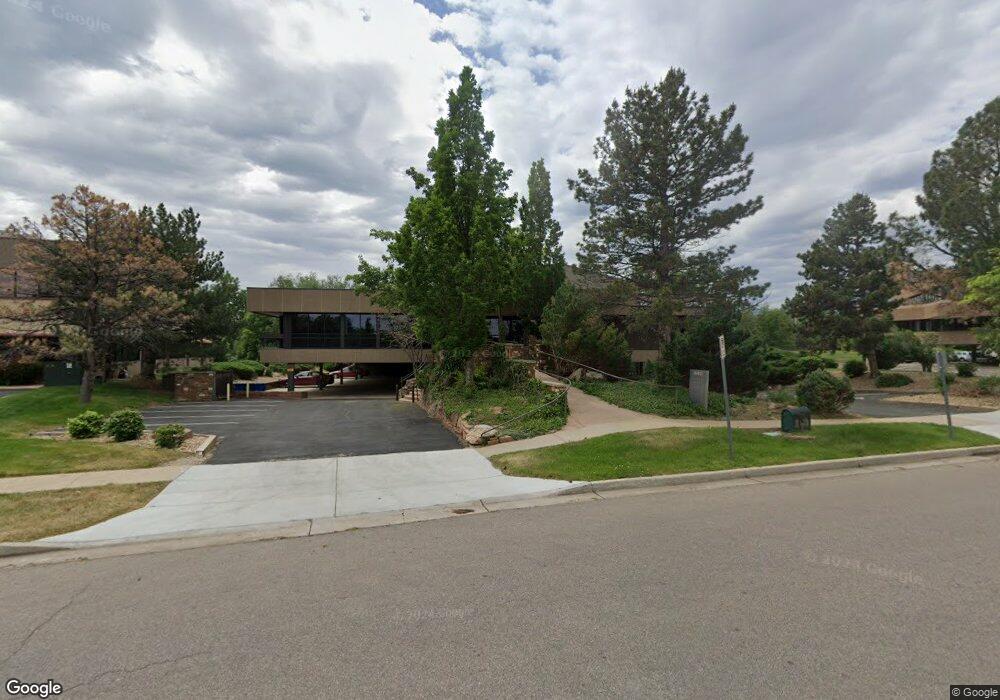
1680 38th St Unit 120 Boulder, CO 80301
Crossroads NeighborhoodEstimated Value: $3,977,775
--
Bed
--
Bath
11,648
Sq Ft
$341/Sq Ft
Est. Value
About This Home
This home is located at 1680 38th St Unit 120, Boulder, CO 80301 and is currently estimated at $3,977,775, approximately $341 per square foot. 1680 38th St Unit 120 is a home located in Boulder County with nearby schools including Douglass Elementary School, Nevin Platt Middle School, and Boulder High School.
Ownership History
Date
Name
Owned For
Owner Type
Purchase Details
Closed on
Aug 17, 2010
Sold by
1680 38Th Street Llc
Bought by
Spring Holdings Llc
Current Estimated Value
Home Financials for this Owner
Home Financials are based on the most recent Mortgage that was taken out on this home.
Original Mortgage
$1,485,000
Outstanding Balance
$981,727
Interest Rate
4.54%
Mortgage Type
Commercial
Estimated Equity
$2,996,048
Purchase Details
Closed on
Jun 10, 2002
Sold by
Taurus Building Llc
Bought by
Eastpark
Purchase Details
Closed on
Jan 21, 1994
Sold by
Cc & W Investments
Bought by
C C & W Investments
Home Financials for this Owner
Home Financials are based on the most recent Mortgage that was taken out on this home.
Original Mortgage
$2,800,000
Interest Rate
7.09%
Mortgage Type
Commercial
Purchase Details
Closed on
Mar 22, 1977
Bought by
Spring Holdings Llc
Create a Home Valuation Report for This Property
The Home Valuation Report is an in-depth analysis detailing your home's value as well as a comparison with similar homes in the area
Home Values in the Area
Average Home Value in this Area
Purchase History
| Date | Buyer | Sale Price | Title Company |
|---|---|---|---|
| Spring Holdings Llc | $1,650,000 | Heritage Title | |
| Eastpark | $975,000 | -- | |
| C C & W Investments | -- | -- | |
| Spring Holdings Llc | -- | -- |
Source: Public Records
Mortgage History
| Date | Status | Borrower | Loan Amount |
|---|---|---|---|
| Open | Spring Holdings Llc | $1,485,000 | |
| Previous Owner | C C & W Investments | $2,800,000 |
Source: Public Records
Tax History Compared to Growth
Tax History
| Year | Tax Paid | Tax Assessment Tax Assessment Total Assessment is a certain percentage of the fair market value that is determined by local assessors to be the total taxable value of land and additions on the property. | Land | Improvement |
|---|---|---|---|---|
| 2025 | $75,888 | $843,750 | $648,027 | $195,723 |
| 2024 | $75,888 | $843,750 | $648,027 | $195,723 |
| 2023 | $74,571 | $863,505 | $669,628 | $202,247 |
| 2022 | $62,080 | $668,508 | $313,200 | $355,308 |
| 2021 | $57,542 | $668,508 | $313,200 | $355,308 |
| 2020 | $57,807 | $664,100 | $313,200 | $350,900 |
| 2019 | $56,922 | $664,100 | $313,200 | $350,900 |
| 2018 | $50,789 | $585,800 | $366,044 | $219,756 |
| 2017 | $55,922 | $665,840 | $366,044 | $299,796 |
| 2016 | $41,170 | $475,600 | $290,000 | $185,600 |
| 2015 | $38,986 | $449,413 | $217,703 | $231,710 |
| 2014 | $37,787 | $449,413 | $217,703 | $231,710 |
Source: Public Records
Map
Nearby Homes
- 3601 Arapahoe Ave Unit 408
- 3701 Arapahoe Ave Unit 210
- 3301 Arapahoe Ave Unit 402
- 3301 Arapahoe Ave Unit 415
- 3301 Arapahoe Ave Unit 405
- 3301 Arapahoe Ave Unit 107
- 3301 Arapahoe Ave Unit 413
- 3401 Arapahoe Ave Unit 419
- 1502 Harrison Ave
- 4703 Harrison Ave
- 1209 Harrison Ct
- 3970 Colorado Ave Unit K
- 1169 Monroe Dr Unit B
- 3860 Colorado Ave Unit C
- 1424 Kennedy Ct
- 995 37th St
- 3460 Madison Ave
- 3000 Colorado Ave Unit B206
- 2885 Springdale Ln
- 2445 Junction Place Unit 205
- 1680 38th St Unit Suite 130
- 1690 38th St
- 4141 Arapahoe Ave
- 1740 38th St
- 1800 38th St
- 3710 Arapahoe Ave Unit 204
- 3795 Arapahoe Ave
- 3601 Arapahoe Ave Unit 432
- 3601 Arapahoe Ave Unit 431
- 3601 Arapahoe Ave Unit 430
- 3601 Arapahoe Ave Unit 429
- 3601 Arapahoe Ave Unit 428
- 3601 Arapahoe Ave Unit 427
- 3601 Arapahoe Ave Unit 426
- 3601 Arapahoe Ave Unit 425
- 3601 Arapahoe Ave Unit 424
- 3601 Arapahoe Ave Unit 423
- 3601 Arapahoe Ave Unit 421
- 3601 Arapahoe Ave Unit 420
- 3601 Arapahoe Ave Unit 417