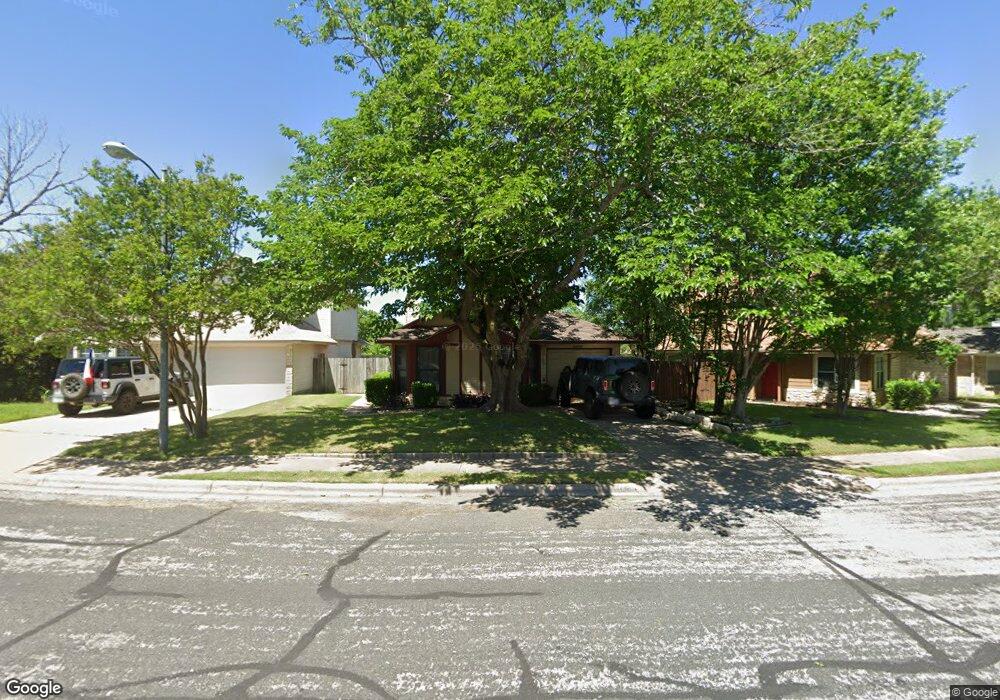
16806 Whitebrush Loop Austin, TX 78717
Brushy Creek NeighborhoodEstimated Value: $299,318 - $317,000
3
Beds
2
Baths
1,285
Sq Ft
$240/Sq Ft
Est. Value
About This Home
This home is located at 16806 Whitebrush Loop, Austin, TX 78717 and is currently estimated at $308,580, approximately $240 per square foot. 16806 Whitebrush Loop is a home located in Williamson County with nearby schools including Brushy Creek Elementary School, Cedar Valley Middle School, and McNeil High School.
Ownership History
Date
Name
Owned For
Owner Type
Purchase Details
Closed on
Dec 21, 2011
Sold by
The Secretary Of Housing & Urban Develop
Bought by
Nagy John A
Current Estimated Value
Home Financials for this Owner
Home Financials are based on the most recent Mortgage that was taken out on this home.
Original Mortgage
$60,607
Outstanding Balance
$41,499
Interest Rate
4.03%
Mortgage Type
New Conventional
Estimated Equity
$267,081
Purchase Details
Closed on
Aug 9, 2010
Sold by
Wells Fargo Bank Na
Bought by
The Secretary Of Housing & Urban Develop
Purchase Details
Closed on
Aug 3, 2010
Sold by
Rodriguez Marc A and Rodriguez Stacey L
Bought by
Wells Fargo Bank Na
Purchase Details
Closed on
May 15, 2009
Sold by
Heyer Connie N and Brushy Creek Village Homeowner
Bought by
Szanyi Wesley K
Create a Home Valuation Report for This Property
The Home Valuation Report is an in-depth analysis detailing your home's value as well as a comparison with similar homes in the area
Home Values in the Area
Average Home Value in this Area
Purchase History
| Date | Buyer | Sale Price | Title Company |
|---|---|---|---|
| Nagy John A | -- | None Available | |
| The Secretary Of Housing & Urban Develop | -- | None Available | |
| Wells Fargo Bank Na | $119,055 | None Available | |
| Szanyi Wesley K | -- | None Available |
Source: Public Records
Mortgage History
| Date | Status | Borrower | Loan Amount |
|---|---|---|---|
| Open | Nagy John A | $60,607 |
Source: Public Records
Tax History
| Year | Tax Paid | Tax Assessment Tax Assessment Total Assessment is a certain percentage of the fair market value that is determined by local assessors to be the total taxable value of land and additions on the property. | Land | Improvement |
|---|---|---|---|---|
| 2025 | $5,708 | $341,526 | $79,500 | $262,026 |
| 2024 | $5,708 | $298,675 | $79,500 | $219,175 |
| 2023 | $6,236 | $323,786 | $83,000 | $240,786 |
| 2022 | $7,930 | $383,137 | $77,000 | $306,137 |
| 2021 | $5,934 | $250,833 | $55,000 | $195,833 |
| 2020 | $4,685 | $196,979 | $49,472 | $147,507 |
| 2019 | $4,915 | $200,718 | $45,800 | $154,918 |
| 2018 | $5,028 | $205,348 | $39,911 | $165,437 |
| 2017 | $4,723 | $189,241 | $37,300 | $151,941 |
| 2016 | $4,230 | $169,497 | $37,300 | $132,197 |
| 2015 | $3,732 | $159,489 | $33,500 | $125,989 |
| 2014 | $3,732 | $148,193 | $0 | $0 |
Source: Public Records
Map
Nearby Homes
- 8903 Pocono Cove
- 16904 Pocono Dr
- 16919 Mouse Trap Dr
- 8700 Tin Roof Cove
- 16601 Malaga Hills Dr
- 16605 Denise Dr
- 9006 Brimstone Ln
- 16803 Dorman Dr
- 3500 Monument Dr
- 606 Splitrock St
- 8412 Hillrock Dr
- 9209 Meyrick Park Trail
- 407 Hillside Dr
- 3902 Hillside Dr
- 8340 Liberty Walk Dr
- 16912 Tidewater Cove
- 7002 Rambollet Terrace
- 8422 Priest River Dr
- 17041 Capri Isle Ln
- 7018 Avignon Dr
- 16804 Whitebrush Loop
- 16808 Whitebrush Loop
- 16810 Whitebrush Loop
- 16812 Whitebrush Loop
- 16813 Whitebrush Loop
- 16814 Whitebrush Loop
- 16815 Whitebrush Loop
- 16811 Whitebrush Loop
- 16817 Whitebrush Loop
- 16819 Whitebrush Loop
- 16809 Whitebrush Loop
- 16803 Whitebrush Loop
- 16816 Whitebrush Loop
- 16805 Whitebrush Loop
- 16821 Whitebrush Loop
- 8901 Pocono Cove
- 16801 Whitebrush Loop
- 16807 Whitebrush Loop
- 16823 Whitebrush Loop
- 16818 Whitebrush Loop
Your Personal Tour Guide
Ask me questions while you tour the home.