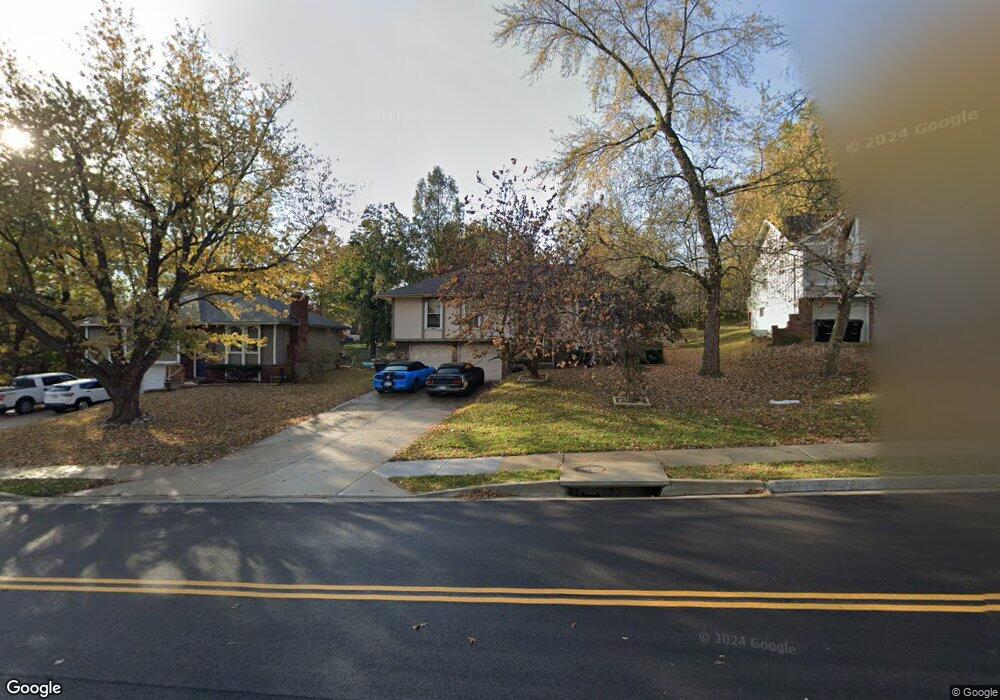
16809 E Salisbury Rd Independence, MO 64056
Spring Branch NeighborhoodEstimated Value: $169,000 - $232,000
3
Beds
2
Baths
1,148
Sq Ft
$183/Sq Ft
Est. Value
About This Home
This home is located at 16809 E Salisbury Rd, Independence, MO 64056 and is currently estimated at $209,850, approximately $182 per square foot. 16809 E Salisbury Rd is a home located in Jackson County with nearby schools including Randall Elementary School, Bridger Middle School, and Bingham Middle School.
Ownership History
Date
Name
Owned For
Owner Type
Purchase Details
Closed on
Jul 8, 2024
Sold by
Mcgee Suretta
Bought by
Common Sense Realty
Current Estimated Value
Purchase Details
Closed on
May 31, 2023
Sold by
Waugh Family Trust
Bought by
Mcgee Syretta
Purchase Details
Closed on
Aug 31, 2012
Sold by
Waugh Susan K
Bought by
Waugh John H and Waugh Susan K
Purchase Details
Closed on
Jul 5, 2005
Sold by
Holt Kyle D and Holt Tiffany S
Bought by
Waugh Susan K
Home Financials for this Owner
Home Financials are based on the most recent Mortgage that was taken out on this home.
Original Mortgage
$72,800
Interest Rate
6.12%
Mortgage Type
Fannie Mae Freddie Mac
Purchase Details
Closed on
Aug 27, 1997
Sold by
Cabler John P and Cabler Sandra J
Bought by
Holt Kyle D and Holt Tiffany S
Home Financials for this Owner
Home Financials are based on the most recent Mortgage that was taken out on this home.
Original Mortgage
$79,560
Interest Rate
7.46%
Mortgage Type
VA
Create a Home Valuation Report for This Property
The Home Valuation Report is an in-depth analysis detailing your home's value as well as a comparison with similar homes in the area
Home Values in the Area
Average Home Value in this Area
Purchase History
| Date | Buyer | Sale Price | Title Company |
|---|---|---|---|
| Common Sense Realty | $102,000 | None Listed On Document | |
| Mcgee Syretta | -- | Chicago Title | |
| Waugh John H | -- | None Available | |
| Waugh Susan K | -- | Stewart Title Of Kansas City | |
| Holt Kyle D | -- | -- |
Source: Public Records
Mortgage History
| Date | Status | Borrower | Loan Amount |
|---|---|---|---|
| Previous Owner | Waugh Susan K | $72,800 | |
| Previous Owner | Holt Kyle D | $79,560 |
Source: Public Records
Tax History
| Year | Tax Paid | Tax Assessment Tax Assessment Total Assessment is a certain percentage of the fair market value that is determined by local assessors to be the total taxable value of land and additions on the property. | Land | Improvement |
|---|---|---|---|---|
| 2025 | $2,179 | $31,911 | $5,058 | $26,853 |
| 2024 | $2,129 | $31,451 | $2,797 | $28,654 |
| 2023 | $2,129 | $31,451 | $3,551 | $27,900 |
| 2022 | $1,782 | $24,130 | $4,608 | $19,522 |
| 2021 | $1,782 | $24,130 | $4,608 | $19,522 |
| 2020 | $1,713 | $22,547 | $4,608 | $17,939 |
| 2019 | $1,686 | $22,547 | $4,608 | $17,939 |
| 2018 | $1,635 | $20,876 | $3,256 | $17,620 |
| 2017 | $1,635 | $20,876 | $3,256 | $17,620 |
| 2016 | $1,610 | $20,353 | $3,327 | $17,026 |
Source: Public Records
Map
Nearby Homes
- 17008 E 2nd St S
- 209 N Gilbert St
- 16909 E 3rd St S
- 16912 E 4th Terrace S
- 320 N M 291 Hwy
- 411 N Queen Ridge Ave
- 17293 E Cheyenne Dr
- 809 N Swope Dr
- 801 N Redwood Dr
- 1820 E Morgan Rd
- 18505 E 5th St N
- 18303 E 7th St N
- 300 N Holder Rd
- 0 Bundschu Rd Unit HMS2577360
- 17304 E Bundschu Rd
- 1749 Sinnott Cir
- 915 N Cochise Dr
- 18602 E 6th St N
- 18607 E 6th St N
- 1215 Berry Rd
- 16805 E Salisbury Rd
- 16813 E Salisbury Rd
- 17008 E 2 St S
- 101 S Downey Ave
- 17004 E 2nd St S
- 17012 E 2nd St S
- 16808 E Salisbury Rd
- 16804 E Salisbury Rd
- 16900 E Salisbury Rd
- 105 S Downey Ave
- 17016 E 2nd St S
- 17016 E 2nd St S N A
- 16800 E Salisbury Rd
- 100 S Downey Ave
- 104 S Downey Ave
- 16904 E Salisbury Rd
- 17009 E 2nd St S
- 17005 E 2nd St S
- 201 S Shrank Ave
- 16712 E Salisbury Rd
Your Personal Tour Guide
Ask me questions while you tour the home.