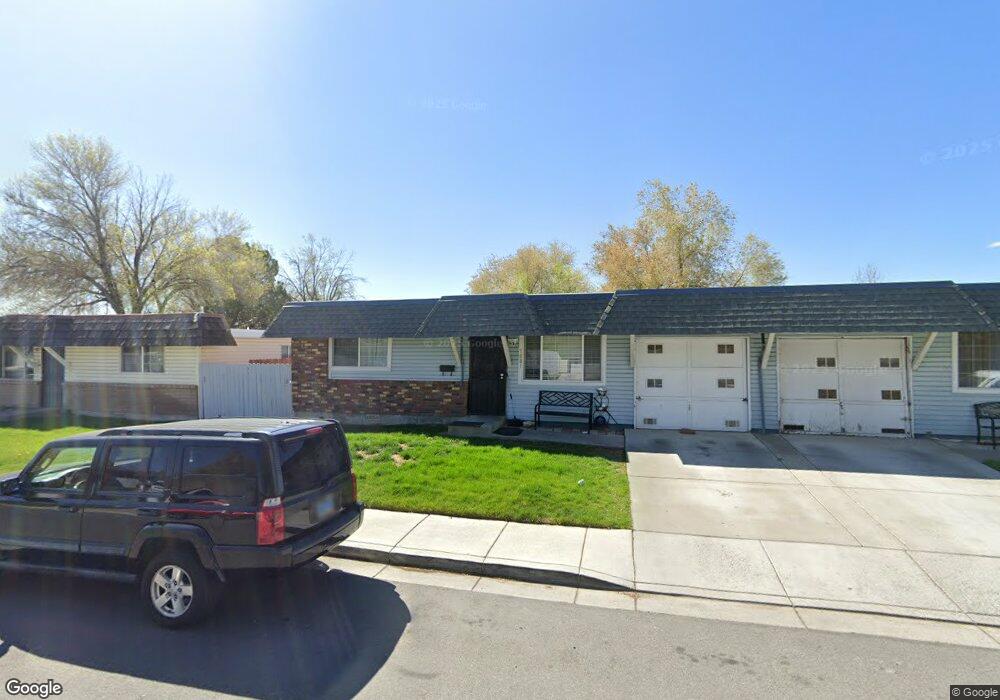
1681 Gault Way Unit F Sparks, NV 89431
North Rock NeighborhoodEstimated Value: $291,295 - $308,000
3
Beds
2
Baths
1,040
Sq Ft
$292/Sq Ft
Est. Value
About This Home
This home is located at 1681 Gault Way Unit F, Sparks, NV 89431 and is currently estimated at $303,324, approximately $291 per square foot. 1681 Gault Way Unit F is a home located in Washoe County with nearby schools including Alice Maxwell Elementary School, Sparks Middle School, and Sparks High School.
Ownership History
Date
Name
Owned For
Owner Type
Purchase Details
Closed on
Aug 19, 2022
Sold by
Munoz Luis Mares and Munoz Irma
Bought by
Luis Mares Munoz And Irma Mares Revocable Liv
Current Estimated Value
Purchase Details
Closed on
May 6, 2022
Sold by
Mares Munoz Luis and Mares Irma
Bought by
Munoz Luis Mares and Mares Irma
Home Financials for this Owner
Home Financials are based on the most recent Mortgage that was taken out on this home.
Original Mortgage
$80,000
Interest Rate
5.27%
Mortgage Type
New Conventional
Purchase Details
Closed on
May 30, 1997
Sold by
Mares Luis
Bought by
Mares Luis and Mares Irma
Purchase Details
Closed on
Jul 14, 1994
Sold by
Baca Rudolph H and Fordyce Baca Linda J
Bought by
Mares Luis
Home Financials for this Owner
Home Financials are based on the most recent Mortgage that was taken out on this home.
Original Mortgage
$65,550
Interest Rate
8.57%
Create a Home Valuation Report for This Property
The Home Valuation Report is an in-depth analysis detailing your home's value as well as a comparison with similar homes in the area
Home Values in the Area
Average Home Value in this Area
Purchase History
| Date | Buyer | Sale Price | Title Company |
|---|---|---|---|
| Luis Mares Munoz And Irma Mares Revocable Liv | -- | -- | |
| Munoz Luis Mares | -- | Stewart Title | |
| Mares Luis | -- | -- | |
| Mares Luis | $69,000 | Western Title Company Inc |
Source: Public Records
Mortgage History
| Date | Status | Borrower | Loan Amount |
|---|---|---|---|
| Previous Owner | Munoz Luis Mares | $80,000 | |
| Previous Owner | Mares Luis | $65,550 |
Source: Public Records
Tax History Compared to Growth
Tax History
| Year | Tax Paid | Tax Assessment Tax Assessment Total Assessment is a certain percentage of the fair market value that is determined by local assessors to be the total taxable value of land and additions on the property. | Land | Improvement |
|---|---|---|---|---|
| 2025 | $700 | $40,667 | $27,370 | $13,297 |
| 2024 | $680 | $39,239 | $25,830 | $13,409 |
| 2023 | $680 | $34,219 | $22,645 | $11,574 |
| 2022 | $625 | $28,280 | $18,480 | $9,800 |
| 2021 | $584 | $21,441 | $11,830 | $9,611 |
| 2020 | $548 | $21,848 | $11,830 | $10,018 |
| 2019 | $522 | $22,126 | $12,040 | $10,086 |
| 2018 | $499 | $17,543 | $7,350 | $10,193 |
| 2017 | $472 | $16,735 | $6,720 | $10,015 |
| 2016 | $228 | $15,947 | $5,495 | $10,452 |
| 2015 | $460 | $15,413 | $4,445 | $10,968 |
| 2014 | $445 | $13,784 | $3,045 | $10,739 |
| 2013 | -- | $13,307 | $2,415 | $10,892 |
Source: Public Records
Map
Nearby Homes
- 1731 Gault Way Unit D
- 1620 Gault Way
- 0 N Mccarran Blvd Unit 250052909
- 1595 York Way
- 1345 Plymouth Way
- 2154 Oppio St
- 1125 Dodson Way
- 1160 York Way
- 1799 Vance Way
- 3269 Valley Forge Way
- 1655 Byrd Dr
- 1110 Xman Way
- 3492 Mashie Dr
- 3252 Holman Way
- 3516 Brassie Dr
- 5530 High Rock Way
- 3116 Sterling Ridge Cir
- 3230 Creekside Ln Unit 1
- 1124 Sbragia Way
- 1780 Greenbrae Dr
- 1683 Gault Way Unit E
- 1669 Gault Way Unit E
- 1687 Gault Way
- 1663 Gault Way
- 1689 Gault Way
- 1667 Gault Way
- 1661 Gault Way Unit B
- 1693 Gault Way Unit E
- 1691 Gault Way Unit F
- 1680 Gault Way Unit A
- 1682 Gault Way
- 1672 Gault Way Unit D
- 1690 Gault Way Unit C
- 1692 Gault Way
- 1670 Gault Way Unit C
- 1653 Gault Way Unit E
- 1662 Gault Way
- 1662 Gault Way Unit B
- 1709 Gault Way
- 1678 Sue Way