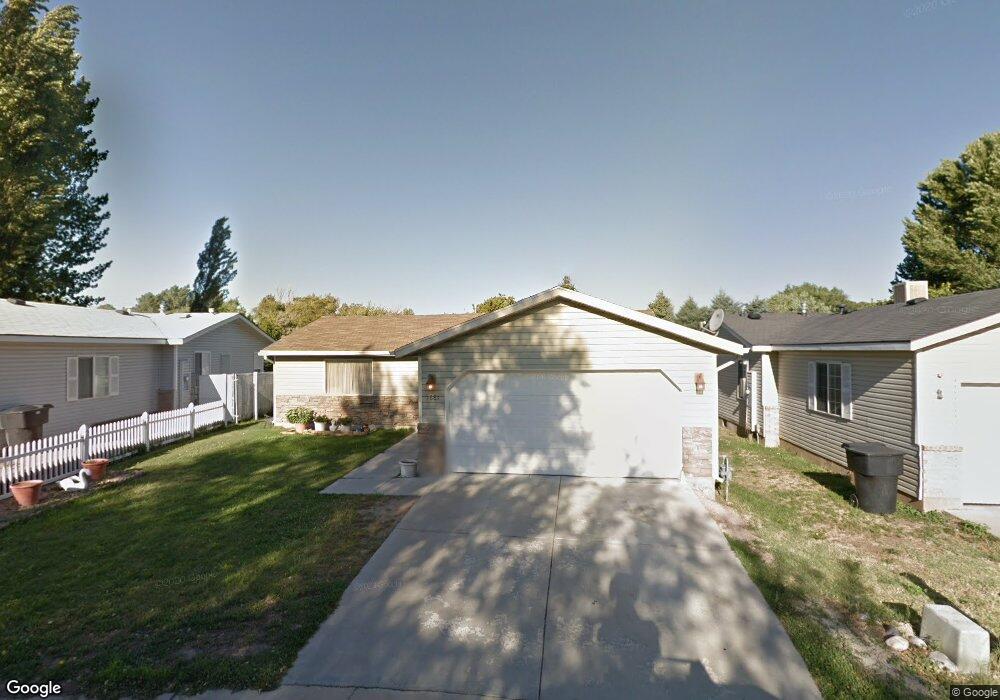
1681 Kylee Ln Ogden, UT 84404
Canyon Road NeighborhoodEstimated Value: $283,000 - $330,000
2
Beds
2
Baths
1,150
Sq Ft
$275/Sq Ft
Est. Value
About This Home
This home is located at 1681 Kylee Ln, Ogden, UT 84404 and is currently estimated at $316,402, approximately $275 per square foot. 1681 Kylee Ln is a home located in Weber County with nearby schools including New Bridge School, Mound Fort Junior High School, and Ben Lomond High School.
Ownership History
Date
Name
Owned For
Owner Type
Purchase Details
Closed on
Oct 30, 2003
Sold by
Willey Steven L
Bought by
Hester James C and Hester Beverley R
Current Estimated Value
Home Financials for this Owner
Home Financials are based on the most recent Mortgage that was taken out on this home.
Original Mortgage
$114,995
Interest Rate
5.98%
Mortgage Type
FHA
Purchase Details
Closed on
Dec 14, 2001
Sold by
Cheney Jonathan H
Bought by
Willey Steven L
Home Financials for this Owner
Home Financials are based on the most recent Mortgage that was taken out on this home.
Original Mortgage
$92,000
Interest Rate
6.57%
Purchase Details
Closed on
Jun 10, 1998
Sold by
Kylee Cove Llc
Bought by
Clyde H Larsen & Sons Construction Inc
Home Financials for this Owner
Home Financials are based on the most recent Mortgage that was taken out on this home.
Original Mortgage
$102,475
Interest Rate
7.17%
Create a Home Valuation Report for This Property
The Home Valuation Report is an in-depth analysis detailing your home's value as well as a comparison with similar homes in the area
Home Values in the Area
Average Home Value in this Area
Purchase History
| Date | Buyer | Sale Price | Title Company |
|---|---|---|---|
| Hester James C | -- | First American Title | |
| Willey Steven L | -- | Bonneville Title | |
| Clyde H Larsen & Sons Construction Inc | -- | -- |
Source: Public Records
Mortgage History
| Date | Status | Borrower | Loan Amount |
|---|---|---|---|
| Previous Owner | Hester James C | $114,995 | |
| Previous Owner | Willey Steven L | $92,000 | |
| Previous Owner | Clyde H Larsen & Sons Construction Inc | $102,475 | |
| Closed | Clyde H Larsen & Sons Construction Inc | $59,500 |
Source: Public Records
Tax History
| Year | Tax Paid | Tax Assessment Tax Assessment Total Assessment is a certain percentage of the fair market value that is determined by local assessors to be the total taxable value of land and additions on the property. | Land | Improvement |
|---|---|---|---|---|
| 2025 | $2,291 | $335,805 | $105,000 | $230,805 |
| 2024 | $2,278 | $180,400 | $57,750 | $122,650 |
| 2023 | $2,188 | $174,350 | $57,750 | $116,600 |
| 2022 | $2,162 | $172,700 | $44,000 | $128,700 |
| 2021 | $1,848 | $245,000 | $55,000 | $190,000 |
| 2020 | $1,812 | $222,000 | $30,000 | $192,000 |
| 2019 | $1,791 | $206,000 | $30,000 | $176,000 |
| 2018 | $1,216 | $139,000 | $20,000 | $119,000 |
| 2017 | $1,137 | $121,400 | $20,000 | $101,400 |
| 2016 | $1,087 | $62,700 | $11,000 | $51,700 |
| 2015 | $1,114 | $62,700 | $11,000 | $51,700 |
| 2014 | $1,134 | $62,700 | $11,000 | $51,700 |
Source: Public Records
Map
Nearby Homes
- 1687 Kylee Ln
- 1027 Sara Ln
- 1068 16th St
- 1095 16th St Unit 2
- 954 16th St Unit 68
- 947 Canyon Rd Unit 15
- 1014 Creekside Dr
- 1167 16th St
- 1849 Van Buren Ave
- 793 E 1500 St S
- 1305 Monroe Blvd Unit 2
- 1435 S 1195 E Unit 19
- 1502 Liberty Ave
- 1266 S 950 E Unit 22
- 1120 Canyon Rd Unit 38
- 1120 Canyon Rd Unit 28
- 1120 Canyon Rd Unit 16
- 1273 16th St
- 1175 Canyon Rd Unit 80
- 1175 Canyon Rd Unit 81
- 1681 Kylee Ln Unit 2
- 1675 Kylee Ln
- 1675 Kylee Ln Unit 3
- 1665 Kylee Ln
- 1672 Kylee Ln Unit 6
- 1670 Fowler Ave
- 1664 Kylee Ln Unit 7
- 1659 Kylee Ln
- 1659 Kylee Ln Unit 5
- 1664 Fowler Ave
- 1664 Fowler Ave
- 1658 Kylee Ln
- 1658 Kylee Ln Unit 8
- 1642 Kylee Ln
- 1650 Fowler Ave
- 1685 Canyonwoods Dr
- 1652 Kylee Ln
- 1681 Canyonwoods Dr
- 1011 River Bend Ln
- 1679 Canyonwoods Dr
Your Personal Tour Guide
Ask me questions while you tour the home.