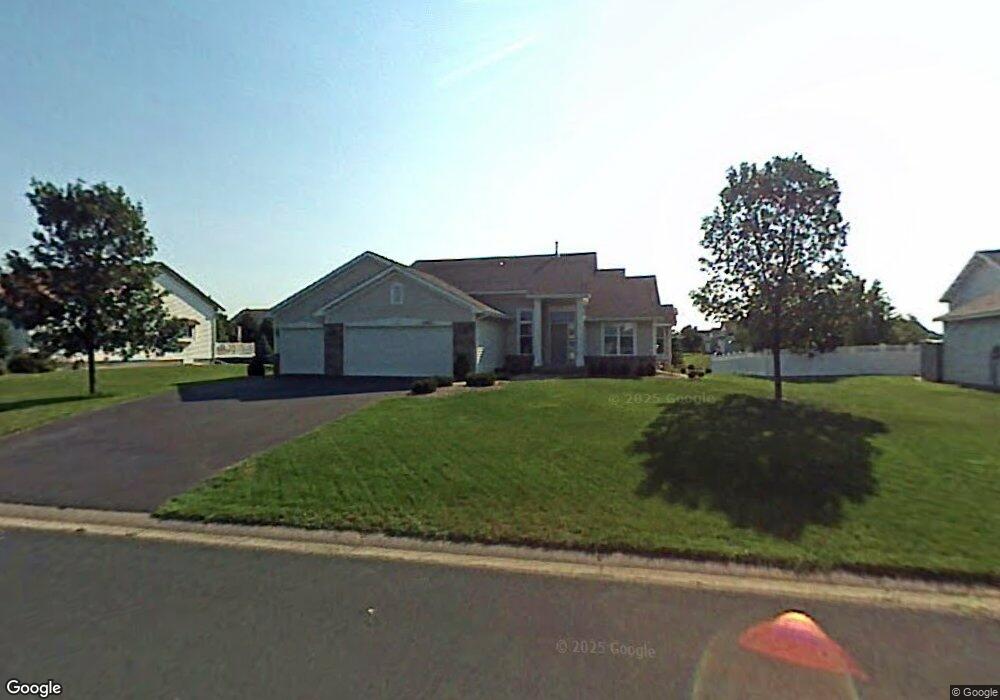
16810 Firestone Path Farmington, MN 55024
Estimated Value: $503,627 - $552,000
4
Beds
3
Baths
1,477
Sq Ft
$357/Sq Ft
Est. Value
About This Home
This home is located at 16810 Firestone Path, Farmington, MN 55024 and is currently estimated at $527,157, approximately $356 per square foot. 16810 Firestone Path is a home located in Dakota County with nearby schools including Parkview Elementary School, Scott Highlands Middle School, and Rosemount Senior High School.
Ownership History
Date
Name
Owned For
Owner Type
Purchase Details
Closed on
Feb 4, 2011
Sold by
Schmitt Douglas J and Watson Melanie K
Bought by
Tran Jason and Tran Dana
Current Estimated Value
Purchase Details
Closed on
May 24, 2005
Sold by
Vanvannguyen Giang Van and Nguyen Teresa Wu
Bought by
Schmitt Douglass J and Watson Melanie K
Purchase Details
Closed on
Jul 21, 1998
Sold by
Butler Housing Corp
Bought by
Vanvannguyen Giang Van and Wu Man Xiu
Purchase Details
Closed on
Mar 27, 1997
Sold by
Lyman Lumber Of Wisconsin
Bought by
Butler Housing Corp
Create a Home Valuation Report for This Property
The Home Valuation Report is an in-depth analysis detailing your home's value as well as a comparison with similar homes in the area
Home Values in the Area
Average Home Value in this Area
Purchase History
| Date | Buyer | Sale Price | Title Company |
|---|---|---|---|
| Tran Jason | $263,500 | -- | |
| Schmitt Douglass J | $324,900 | -- | |
| Vanvannguyen Giang Van | $168,000 | -- | |
| Butler Housing Corp | $35,900 | -- |
Source: Public Records
Tax History Compared to Growth
Tax History
| Year | Tax Paid | Tax Assessment Tax Assessment Total Assessment is a certain percentage of the fair market value that is determined by local assessors to be the total taxable value of land and additions on the property. | Land | Improvement |
|---|---|---|---|---|
| 2024 | $5,114 | $474,400 | $91,900 | $382,500 |
| 2023 | $5,114 | $484,800 | $91,600 | $393,200 |
| 2022 | $4,248 | $466,400 | $91,300 | $375,100 |
| 2021 | $4,044 | $389,500 | $79,400 | $310,100 |
| 2020 | $4,072 | $359,300 | $75,600 | $283,700 |
| 2019 | $3,767 | $351,900 | $72,000 | $279,900 |
| 2018 | $3,544 | $341,300 | $68,600 | $272,700 |
| 2017 | $3,539 | $314,100 | $65,300 | $248,800 |
| 2016 | $3,559 | $300,000 | $62,200 | $237,800 |
| 2015 | $3,398 | $285,618 | $58,146 | $227,472 |
| 2014 | -- | $275,263 | $56,358 | $218,905 |
| 2013 | -- | $251,719 | $51,084 | $200,635 |
Source: Public Records
Map
Nearby Homes
- 16563 Fishing Ave W
- 17126 Firtree Place
- 6649 167th St W
- 6678 166th St W
- 16546 Foliage Ave W
- 6656 Gerdine Path W
- 17415 Fireside Ln
- 6634 162nd Ct Unit 421
- 6882 173rd St W
- 16660 Garland Way W
- 7130 167th Ct W
- 6744 Foliage Ct W
- 17583 Foxboro Ln
- 6852 161st St W
- 16793 Embers Ave Unit 606
- 16809 Embers Ave Unit 702
- 16895 Embers Ave
- 6414 158th St W Unit 201
- 17373 N Creek Dr
- 16424 Elm Creek Ln Unit 4029
- 16810 16810 Firestone Path
- 16780 16780 Firestone Path
- 16780 Firestone Path
- 16840 Firestone Path
- 16813 Fieldcrest Ave
- 16795 Fieldcrest Ave
- 16833 Fieldcrest Ave
- 16833 16833 Fieldcrest-Avenue-
- 16785 Firestone Path
- 16758 Firestone Path
- 16758 16758 Firestone-Path-
- 16758 16758 Firestone Path
- 6317 169th St W
- 6335 169th St W
- 16775 Fieldcrest Ave
- 16755 16755 Firestone Way
- 16755 Firestone Way
- 6299 169th St W
- 16754 16754 Firestone Path
- 16815 Firestone Path