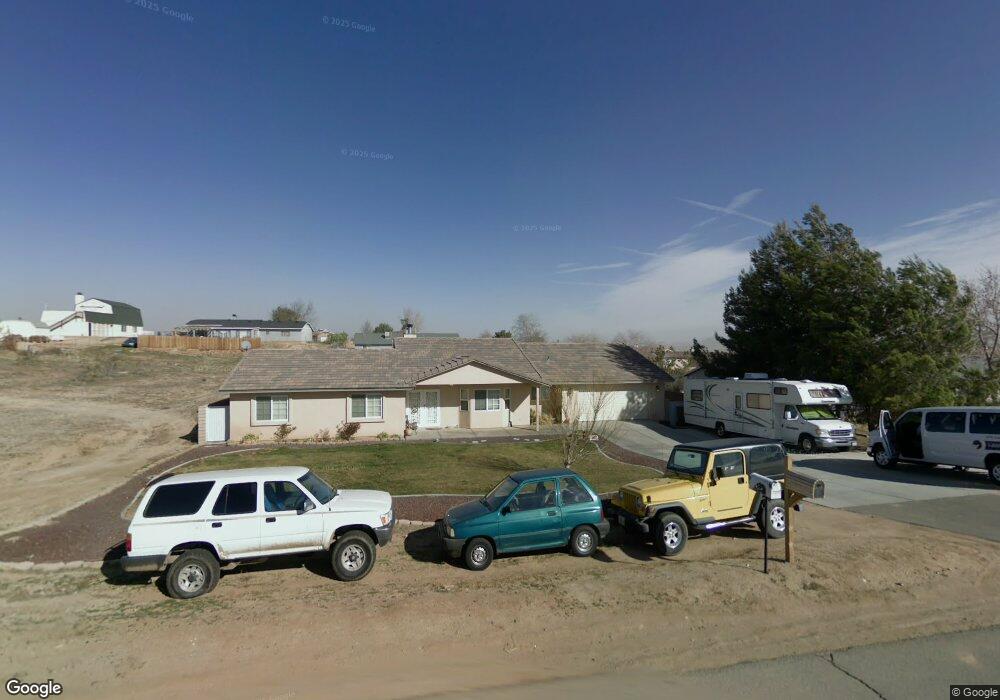
16812 Sholic St Victorville, CA 92395
Estimated Value: $438,000 - $499,239
3
Beds
2
Baths
2,101
Sq Ft
$222/Sq Ft
Est. Value
About This Home
This home is located at 16812 Sholic St, Victorville, CA 92395 and is currently estimated at $466,810, approximately $222 per square foot. 16812 Sholic St is a home located in San Bernardino County with nearby schools including Lomitas Elementary School, Mojave Vista Elementary School, and Lakeview Leadership Academy.
Ownership History
Date
Name
Owned For
Owner Type
Purchase Details
Closed on
Jul 12, 2021
Sold by
Richards Tracey
Bought by
Richards Tracey and Gwinn Richard W
Current Estimated Value
Home Financials for this Owner
Home Financials are based on the most recent Mortgage that was taken out on this home.
Original Mortgage
$238,300
Outstanding Balance
$216,220
Interest Rate
2.9%
Mortgage Type
New Conventional
Estimated Equity
$250,590
Purchase Details
Closed on
Jun 15, 2020
Sold by
Richards Tracey and Richards Tracey I
Bought by
Richards Tracey I and Gwinn Richard W
Home Financials for this Owner
Home Financials are based on the most recent Mortgage that was taken out on this home.
Original Mortgage
$240,000
Interest Rate
3.2%
Mortgage Type
New Conventional
Purchase Details
Closed on
Jul 21, 2005
Sold by
Pl & D Investments
Bought by
Cote Shan Jin
Purchase Details
Closed on
Feb 26, 2002
Sold by
Locatell La Verne
Bought by
Richards Tracey
Create a Home Valuation Report for This Property
The Home Valuation Report is an in-depth analysis detailing your home's value as well as a comparison with similar homes in the area
Home Values in the Area
Average Home Value in this Area
Purchase History
| Date | Buyer | Sale Price | Title Company |
|---|---|---|---|
| Richards Tracey | -- | Solidifi Title & Closing | |
| Richards Tracey I | -- | Solidifi Title & Closing | |
| Cote Shan Jin | $294,000 | First American | |
| Richards Tracey | $12,000 | First American Title Ins Co |
Source: Public Records
Mortgage History
| Date | Status | Borrower | Loan Amount |
|---|---|---|---|
| Open | Richards Tracey | $238,300 | |
| Closed | Richards Tracey I | $240,000 |
Source: Public Records
Tax History Compared to Growth
Tax History
| Year | Tax Paid | Tax Assessment Tax Assessment Total Assessment is a certain percentage of the fair market value that is determined by local assessors to be the total taxable value of land and additions on the property. | Land | Improvement |
|---|---|---|---|---|
| 2025 | $3,181 | $280,656 | $17,730 | $262,926 |
| 2024 | $3,181 | $275,153 | $17,382 | $257,771 |
| 2023 | $3,149 | $269,758 | $17,041 | $252,717 |
| 2022 | $3,095 | $264,469 | $16,707 | $247,762 |
| 2021 | $3,026 | $259,283 | $16,379 | $242,904 |
| 2020 | $2,972 | $256,624 | $16,211 | $240,413 |
| 2019 | $2,921 | $251,592 | $15,893 | $235,699 |
| 2018 | $3,115 | $246,658 | $15,581 | $231,077 |
| 2017 | $3,049 | $241,821 | $15,275 | $226,546 |
| 2016 | $2,917 | $229,000 | $45,600 | $183,400 |
| 2015 | $2,624 | $211,000 | $42,000 | $169,000 |
| 2014 | $2,456 | $197,800 | $39,100 | $158,700 |
Source: Public Records
Map
Nearby Homes
- 13077 1st Ave
- 13035 Troy Ct
- 16654 Sholic St
- 16931 Sorrento Ln
- 16591 Ponca St
- 12764 Amber Creek Cir
- 16605 Ottawa St
- 12814 Hawks Hill St
- 16850 Hidden Creek Dr
- 13357 Calcite Ave
- 12733 Appian Ave
- 16976 Torino Dr
- 0 4th Unit HD25008138
- 16657 Country Ranch Ct
- 16546 Biola Place
- 0 Second Ave
- 16319 Teton St
- 16305 Teton St
- 13212 6th Ave
- 13224 Sixth Ave
- 16824 Sholic St
- 16819 Winona St
- 16840 Sholic St
- 16797 Winona St
- 16821 Winona St
- 16778 Sholic St
- 16811 Sholic St
- 16827 Winona St
- 16795 Sholic St
- 16777 Winona St
- 16837 Winona St
- 16760 Sholic St
- 16854 Sholic St
- 16777 Sholic St
- 16761 Winona St
- 16855 Winona St
- 16755 Sholic St
- 16743 Winona St
- 16810 Winona St