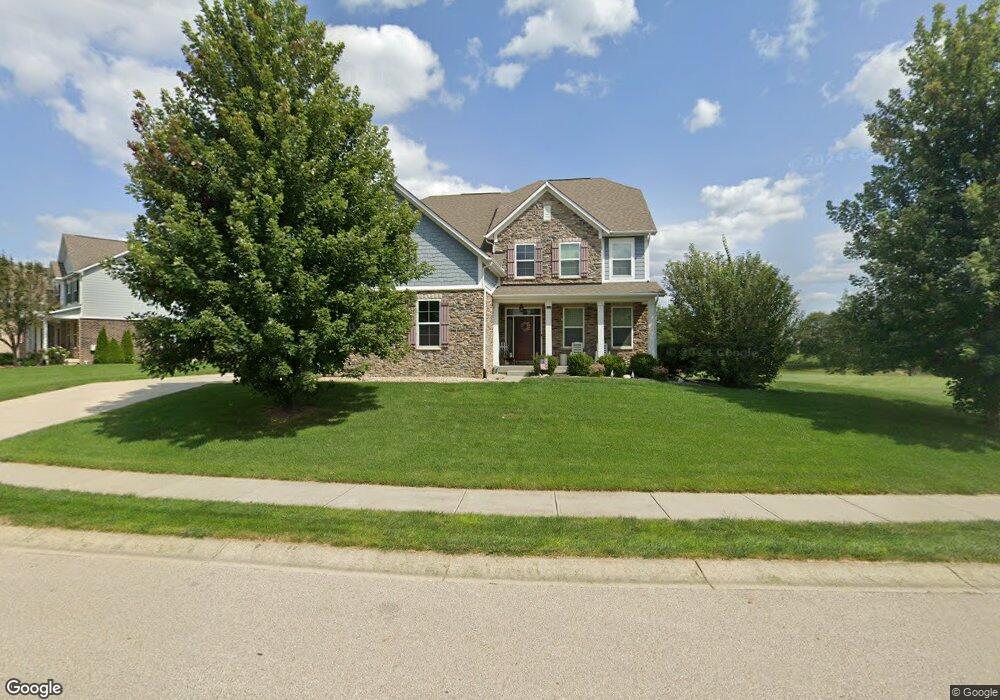
16815 Hawk Creek Cir Westfield, IN 46074
West Noblesville NeighborhoodEstimated Value: $753,000 - $896,000
5
Beds
5
Baths
4,794
Sq Ft
$171/Sq Ft
Est. Value
About This Home
This home is located at 16815 Hawk Creek Cir, Westfield, IN 46074 and is currently estimated at $819,824, approximately $171 per square foot. 16815 Hawk Creek Cir is a home located in Hamilton County with nearby schools including Carey Ridge Elementary School, Westfield Intermediate School, and Westfield Middle School.
Ownership History
Date
Name
Owned For
Owner Type
Purchase Details
Closed on
Apr 11, 2016
Sold by
Wiernik David I
Bought by
Wiernik David I and Wiernik Jill R
Current Estimated Value
Purchase Details
Closed on
Jun 12, 2015
Sold by
Beazer Homes Indiana Llp
Bought by
Wiernik David I
Home Financials for this Owner
Home Financials are based on the most recent Mortgage that was taken out on this home.
Original Mortgage
$371,549
Outstanding Balance
$254,247
Interest Rate
0.78%
Mortgage Type
New Conventional
Estimated Equity
$565,577
Purchase Details
Closed on
Feb 18, 2010
Sold by
Beacon Hill I & Ii Llc
Bought by
Beacon Hill 1 & 2 Llc
Home Financials for this Owner
Home Financials are based on the most recent Mortgage that was taken out on this home.
Original Mortgage
$3,250,000
Interest Rate
5.01%
Mortgage Type
Future Advance Clause Open End Mortgage
Purchase Details
Closed on
Aug 30, 2009
Sold by
Kozel Paul L and Case Richard
Bought by
Beacon Hill I & Ii Llc
Create a Home Valuation Report for This Property
The Home Valuation Report is an in-depth analysis detailing your home's value as well as a comparison with similar homes in the area
Home Values in the Area
Average Home Value in this Area
Purchase History
| Date | Buyer | Sale Price | Title Company |
|---|---|---|---|
| Wiernik David I | -- | First American Title Ins Co | |
| Wiernik David I | -- | First American Title Ins Co | |
| Beacon Hill 1 & 2 Llc | -- | None Available | |
| Beacon Hill I & Ii Llc | -- | None Available |
Source: Public Records
Mortgage History
| Date | Status | Borrower | Loan Amount |
|---|---|---|---|
| Open | Wiernik David I | $371,549 | |
| Previous Owner | Beacon Hill 1 & 2 Llc | $3,250,000 |
Source: Public Records
Tax History Compared to Growth
Tax History
| Year | Tax Paid | Tax Assessment Tax Assessment Total Assessment is a certain percentage of the fair market value that is determined by local assessors to be the total taxable value of land and additions on the property. | Land | Improvement |
|---|---|---|---|---|
| 2024 | $7,273 | $677,200 | $69,100 | $608,100 |
| 2023 | $7,273 | $636,400 | $69,100 | $567,300 |
| 2022 | $6,585 | $562,800 | $69,100 | $493,700 |
| 2021 | $5,796 | $481,300 | $69,100 | $412,200 |
| 2020 | $5,725 | $470,800 | $69,100 | $401,700 |
| 2019 | $5,725 | $470,800 | $69,100 | $401,700 |
| 2018 | $5,687 | $467,400 | $69,100 | $398,300 |
| 2017 | $4,931 | $440,300 | $69,100 | $371,200 |
| 2016 | $5,017 | $447,900 | $69,100 | $378,800 |
| 2014 | $18 | $600 | $600 | $0 |
| 2013 | $18 | $600 | $600 | $0 |
Source: Public Records
Map
Nearby Homes
- 3560 Blenheim Place
- 3702 Crest Point Dr
- 16693 Reed Dr
- 16671 Reed Dr
- 16681 Reed Dr
- 16661 Reed Dr
- 16716 Breton Rd
- 16710 Breton Rd
- 16424 Brookhollow Dr
- 3547 Heathcliff Ct
- 17237 Dallington St
- 17252 Henslow Dr
- 17275 Dovehouse Ln
- 3536 Tolworth Ln
- 17355 Wetherington Dr
- 0 E 161st St Unit MBR22071011
- 4453 Miller Way
- 4497 Elkhorn Dr
- 17482 Ebling Trail
- 17490 Ebling Trail
- 16829 Hawk Creek Cir
- 16820 Hawk Creek Cir
- 16808 Hawk Creek Cir
- 16814 Hawk Creek Cir
- 16835 Hawk Creek Cir
- 16826 Hawk Creek Cir
- 16832 Hawk Creek Cir
- 16802 Hawk Creek Cir
- 16841 Hawk Creek Cir
- 16838 Hawk Creek Cir
- 16847 Hawk Creek Cir
- 16844 Hawk Creek Cir
- 16860 Hawk Creek Cir
- 16727 Hawk Creek Cir
- 16719 Hawk Creek Cir
- 16764 Hawk Creek Cir
- 16847 Gaither Blvd
- 16711 Hawk Creek Cir
- 2929 Sawtooth Oak Ct