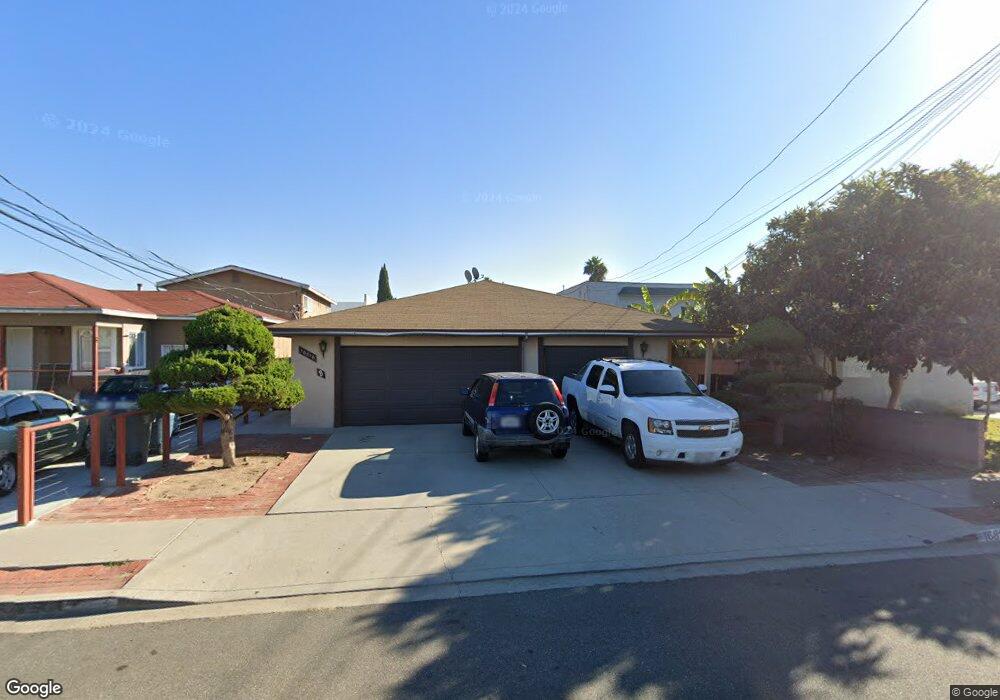
16816 S New Hampshire Ave Unit A Gardena, CA 90247
Estimated Value: $807,666 - $1,116,000
4
Beds
2
Baths
2,135
Sq Ft
$462/Sq Ft
Est. Value
About This Home
This home is located at 16816 S New Hampshire Ave Unit A, Gardena, CA 90247 and is currently estimated at $987,417, approximately $462 per square foot. 16816 S New Hampshire Ave Unit A is a home located in Los Angeles County with nearby schools including Gardena Elementary School, Robert E. Peary Middle School, and Gardena Senior High School.
Ownership History
Date
Name
Owned For
Owner Type
Purchase Details
Closed on
Mar 2, 2005
Sold by
Seddon Alexis D
Bought by
Fuentes Jesus and Fuentes Marie O
Current Estimated Value
Home Financials for this Owner
Home Financials are based on the most recent Mortgage that was taken out on this home.
Original Mortgage
$145,000
Interest Rate
5.65%
Mortgage Type
New Conventional
Purchase Details
Closed on
Apr 17, 2001
Sold by
Harris Clara H
Bought by
Fuentes Jesus and Fuentes Marie O
Home Financials for this Owner
Home Financials are based on the most recent Mortgage that was taken out on this home.
Original Mortgage
$176,250
Interest Rate
6.98%
Purchase Details
Closed on
Aug 14, 1997
Sold by
Terasawa Louise A
Bought by
Terasawa Louise A and The Louise A Terasawa Trust
Create a Home Valuation Report for This Property
The Home Valuation Report is an in-depth analysis detailing your home's value as well as a comparison with similar homes in the area
Home Values in the Area
Average Home Value in this Area
Purchase History
| Date | Buyer | Sale Price | Title Company |
|---|---|---|---|
| Fuentes Jesus | -- | Orange Coast Title | |
| Fuentes Jesus | $235,000 | Equity Title | |
| Terasawa Louise A | -- | -- |
Source: Public Records
Mortgage History
| Date | Status | Borrower | Loan Amount |
|---|---|---|---|
| Closed | Fuentes Jesus | $145,000 | |
| Previous Owner | Fuentes Jesus | $176,250 |
Source: Public Records
Tax History Compared to Growth
Tax History
| Year | Tax Paid | Tax Assessment Tax Assessment Total Assessment is a certain percentage of the fair market value that is determined by local assessors to be the total taxable value of land and additions on the property. | Land | Improvement |
|---|---|---|---|---|
| 2025 | $4,685 | $354,084 | $127,767 | $226,317 |
| 2024 | $4,685 | $347,142 | $125,262 | $221,880 |
| 2023 | $4,604 | $340,336 | $122,806 | $217,530 |
| 2022 | $4,382 | $333,664 | $120,399 | $213,265 |
| 2021 | $4,328 | $327,123 | $118,039 | $209,084 |
| 2019 | $4,191 | $317,423 | $114,539 | $202,884 |
| 2018 | $4,074 | $311,200 | $112,294 | $198,906 |
| 2016 | $3,878 | $299,118 | $107,935 | $191,183 |
| 2015 | $3,813 | $294,626 | $106,314 | $188,312 |
| 2014 | $3,818 | $288,856 | $104,232 | $184,624 |
Source: Public Records
Map
Nearby Homes
- 1040 W 165th Place
- 16828 S Budlong Ave
- 17002 S Catalina Ave
- 1213 W 168th St Unit C
- 762 W Gardena Blvd
- 17035 S Catalina Ave
- 16911 S Raymond Place
- 710 W 172nd St
- 1308 W 163rd St Unit 1
- 16701 S Denver Ave
- 16619 S Denver Ave
- 527 W 169th St
- 16001 S Vermont Ave Unit 60
- 16122 S Denver Ave
- 16101 S Figueroa St
- 16720 S Dalton Ave
- 16938 S Dalton Ave
- 1144 Magnolia Ave
- 17039 S Dalton Ave
- 15534 S Budlong Place
- 16812 S New Hampshire Ave Unit C
- 16812 S New Hampshire Ave Unit A
- 16812 S New Hampshire Ave
- 16822 S New Hampshire Ave
- 16826 S New Hampshire Ave
- 16813 S Vermont Ave
- 1032 W 168th St
- 1022 W 168th St Unit B
- 1026 W 168th St Unit 1024
- 1026 W 168th St
- 16832 S New Hampshire Ave
- 16815 S New Hampshire Ave
- 16813 S New Hampshire Ave
- 16819 S New Hampshire Ave
- 1038 W 168th St
- 1034 168th St W Unit 1034
- 16833 S Vermont Ave
- 16836 S New Hampshire Ave
- 16821 S New Hampshire Ave
- 16803 S Vermont Ave