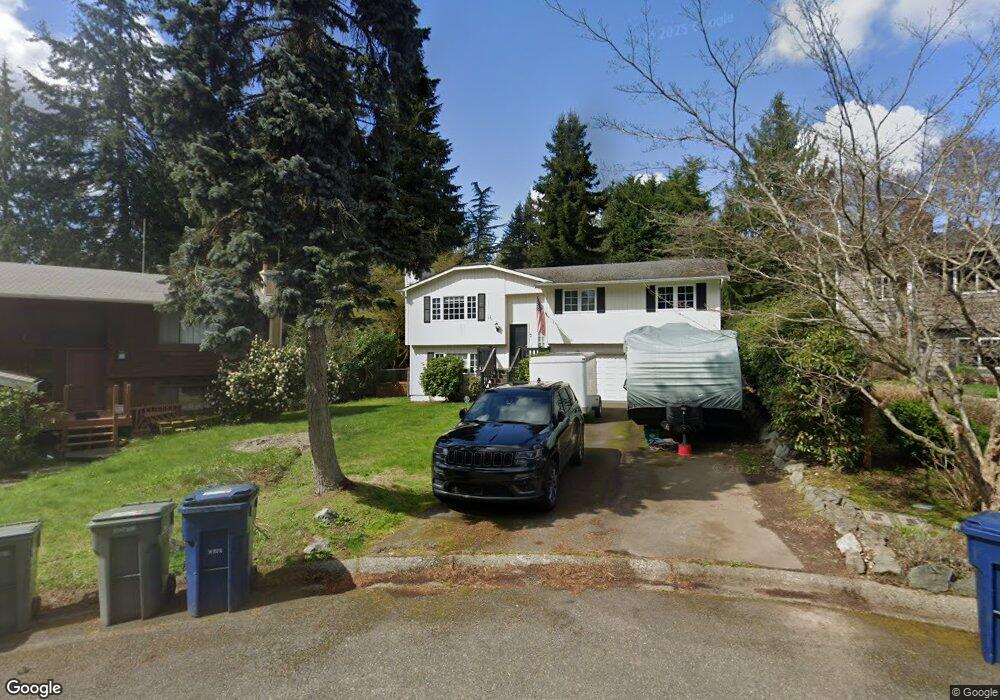
16818 22nd Ave SE Bothell, WA 98012
North Creek NeighborhoodEstimated Value: $797,000 - $895,000
3
Beds
3
Baths
1,604
Sq Ft
$523/Sq Ft
Est. Value
About This Home
This home is located at 16818 22nd Ave SE, Bothell, WA 98012 and is currently estimated at $838,241, approximately $522 per square foot. 16818 22nd Ave SE is a home located in Snohomish County with nearby schools including Woodside Elementary School, Heatherwood Middle School, and Henry M. Jackson High School.
Ownership History
Date
Name
Owned For
Owner Type
Purchase Details
Closed on
Jul 24, 2017
Sold by
Vanduzer Thomas E
Bought by
Xiao Muyu and Yang Yanping
Current Estimated Value
Purchase Details
Closed on
Jan 10, 2007
Sold by
Vanduzer Shirley
Bought by
Vanduzer Thomas E
Home Financials for this Owner
Home Financials are based on the most recent Mortgage that was taken out on this home.
Original Mortgage
$389,000
Interest Rate
6.4%
Mortgage Type
Purchase Money Mortgage
Purchase Details
Closed on
Mar 17, 2000
Sold by
Vavra Jay M and Vavra Laura E
Bought by
Hart Matthew R and Hart Heather K
Home Financials for this Owner
Home Financials are based on the most recent Mortgage that was taken out on this home.
Original Mortgage
$175,600
Interest Rate
8.34%
Create a Home Valuation Report for This Property
The Home Valuation Report is an in-depth analysis detailing your home's value as well as a comparison with similar homes in the area
Home Values in the Area
Average Home Value in this Area
Purchase History
| Date | Buyer | Sale Price | Title Company |
|---|---|---|---|
| Xiao Muyu | $466,000 | Wfg Natl Title Co Of Wa Llc | |
| Vanduzer Thomas E | $56,179 | Ticor | |
| Vanduzer Thomas E | $389,000 | Ticor | |
| Hart Matthew R | $219,500 | Evergreen Title Company Inc |
Source: Public Records
Mortgage History
| Date | Status | Borrower | Loan Amount |
|---|---|---|---|
| Previous Owner | Vanduzer Thomas E | $389,000 | |
| Previous Owner | Hart Matthew R | $175,600 |
Source: Public Records
Tax History Compared to Growth
Tax History
| Year | Tax Paid | Tax Assessment Tax Assessment Total Assessment is a certain percentage of the fair market value that is determined by local assessors to be the total taxable value of land and additions on the property. | Land | Improvement |
|---|---|---|---|---|
| 2025 | $6,559 | $753,300 | $525,000 | $228,300 |
| 2024 | $6,559 | $680,600 | $460,000 | $220,600 |
| 2023 | $6,956 | $792,100 | $535,000 | $257,100 |
| 2022 | $5,887 | $579,600 | $362,000 | $217,600 |
| 2020 | $5,815 | $481,400 | $290,000 | $191,400 |
| 2019 | $5,480 | $455,000 | $270,000 | $185,000 |
| 2018 | $5,251 | $397,000 | $230,000 | $167,000 |
| 2017 | $4,563 | $346,800 | $190,000 | $156,800 |
| 2016 | $3,947 | $314,600 | $167,000 | $147,600 |
| 2015 | $3,927 | $296,800 | $164,000 | $132,800 |
| 2013 | $3,797 | $254,300 | $122,000 | $132,300 |
Source: Public Records
Map
Nearby Homes
- 3410 165th St SE
- 1621 Seattle Hill Rd Unit Q2
- 2015 Mill Pointe Dr SE
- 1325 Seattle Hill Rd Unit A2
- 2400 177th St SE
- 1616 175th Place SE
- 2120 178th St SE
- 17824 19th Ave SE
- 5 xx 158th St SE
- 16101 Bothell Everett Hwy Unit J3
- 16101 Bothell Everett Hwy Unit I5
- 16008 30th Dr SE
- 18008 25th Dr SE
- 16606 35th Ave SE Unit 9A
- KIMBALL Plan at Tambark Estates
- 15901 30th Dr SE
- 18222 19th Dr SE
- 16119 35th Dr SE
- 3205 179th Place SE
- 3701 170th Place SE
- 16815 22nd Ave SE
- 16826 22nd Ave SE
- 2116 168th St SE
- 2126 168th St SE
- 2206 168th St SE
- 2118 168th St SE
- 16819 22nd Ave SE
- 16910 22nd Ave SE
- 2114 168th St SE
- 2214 168th St SE
- 16825 22nd Ave SE
- 16909 21st Ave SE
- 16905 21st Ave SE
- 16903 22nd Ave SE
- 2222 168th St SE
- 16901 21st Ave SE
- 2125 169th Place SE
- 2102 168th St SE
- 2131 169th Place SE
- 2117 169th Place SE