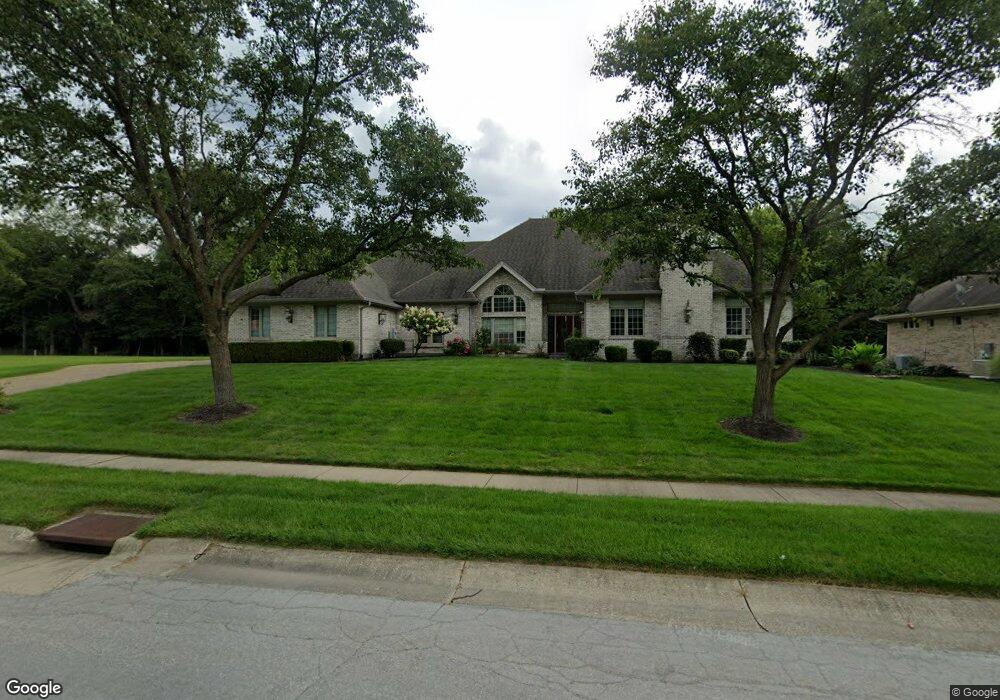
1682 Fox Trail Bellbrook, OH 45305
Estimated Value: $648,000 - $788,000
4
Beds
4
Baths
5,016
Sq Ft
$143/Sq Ft
Est. Value
About This Home
This home is located at 1682 Fox Trail, Bellbrook, OH 45305 and is currently estimated at $715,934, approximately $142 per square foot. 1682 Fox Trail is a home located in Greene County with nearby schools including Stephen Bell Elementary School, Bell Creek Intermediate School, and Bellbrook Middle School.
Ownership History
Date
Name
Owned For
Owner Type
Purchase Details
Closed on
Feb 24, 2017
Sold by
Darragh Steven M and Darragh Barbara L
Bought by
Egan Mary J and Brancheau Egan M Jean
Current Estimated Value
Purchase Details
Closed on
Dec 18, 1997
Sold by
Elden J Heinz Trst
Bought by
Darragh Steven M and Darragh L
Home Financials for this Owner
Home Financials are based on the most recent Mortgage that was taken out on this home.
Original Mortgage
$250,000
Interest Rate
7.36%
Mortgage Type
New Conventional
Purchase Details
Closed on
Aug 2, 1996
Sold by
Patricia A Emonin Trst
Bought by
Elden J Heinz Trustee
Home Financials for this Owner
Home Financials are based on the most recent Mortgage that was taken out on this home.
Original Mortgage
$290,000
Interest Rate
8.33%
Mortgage Type
New Conventional
Purchase Details
Closed on
May 29, 1996
Sold by
Wildlife Village Inc
Bought by
Patricia A Emonin Trustee
Create a Home Valuation Report for This Property
The Home Valuation Report is an in-depth analysis detailing your home's value as well as a comparison with similar homes in the area
Home Values in the Area
Average Home Value in this Area
Purchase History
| Date | Buyer | Sale Price | Title Company |
|---|---|---|---|
| Egan Mary J | $440,000 | None Available | |
| Darragh Steven M | $410,000 | -- | |
| Elden J Heinz Trustee | $60,000 | -- | |
| Patricia A Emonin Trustee | $60,000 | -- |
Source: Public Records
Mortgage History
| Date | Status | Borrower | Loan Amount |
|---|---|---|---|
| Previous Owner | Darragh Steven M | $250,000 | |
| Previous Owner | Elden J Heinz Trustee | $290,000 |
Source: Public Records
Tax History
| Year | Tax Paid | Tax Assessment Tax Assessment Total Assessment is a certain percentage of the fair market value that is determined by local assessors to be the total taxable value of land and additions on the property. | Land | Improvement |
|---|---|---|---|---|
| 2024 | $11,032 | $199,230 | $26,180 | $173,050 |
| 2023 | $11,032 | $199,230 | $26,180 | $173,050 |
| 2022 | $11,956 | $180,310 | $26,180 | $154,130 |
| 2021 | $12,090 | $180,310 | $26,180 | $154,130 |
| 2020 | $11,293 | $180,310 | $26,180 | $154,130 |
| 2019 | $10,513 | $154,000 | $26,300 | $127,700 |
| 2018 | $11,788 | $154,000 | $26,300 | $127,700 |
| 2017 | $11,497 | $172,380 | $26,300 | $146,080 |
| 2016 | $11,910 | $168,910 | $26,300 | $142,610 |
| 2015 | $11,718 | $168,910 | $26,300 | $142,610 |
| 2014 | $10,812 | $168,910 | $26,300 | $142,610 |
Source: Public Records
Map
Nearby Homes
- 3849 Sable Ridge Dr
- 2250 Jacob Hills Ct
- 1900 N Belleview Dr
- 1939 Sugar Run Trail
- 1478 Country Wood Dr
- 4206 N Golden Clove Bend Unit 56-303
- 4208 N Golden Clove Bend Unit 56-103
- 4214 N Golden Clove Bend Unit 56-102
- 4216 N Golden Clove Bend Unit 56-302
- 4222 N Golden Clove Bend Unit 56-201
- 4218 N Golden Clove Bend Unit 56-300
- 4228 Apple Branch Dr Unit 55-204
- 4232 Apple Branch Dr Unit 55-305
- 4236 Apple Branch Dr Unit 55-103
- 4242 Apple Branch Dr Unit 55-102
- 4244 Apple Branch Dr Unit 55-302
- 4246 Apple Branch Dr Unit 55-300
- 1860 Bledsoe Dr
- 4252 Apple Branch Dr Unit 55-201
- 2016 Wentworth Village Dr Unit 2016
- 1696 Fox Trail
- 1675 Fox Trail
- 1687 Fox Trail
- 1661 Fox Trail
- 1710 Fox Trail
- 1701 Fox Trail
- Lot 5 Fox Trail
- Lot 6 Fox Trail
- 0 Fox Trail Unit 584117
- 0 Fox Trail Unit 357912
- 1658 Cedar Ct
- 4031 Poston Dr
- 1662 Cedar Ct
- 1644 Fox Trail
- 1641 Fox Trail
- 1652 Cedar Ct
- 1734 Kensington Dr
- 4030 Poston Dr
- 1665 Cedar Ct
- 1628 Fox Trail
Your Personal Tour Guide
Ask me questions while you tour the home.