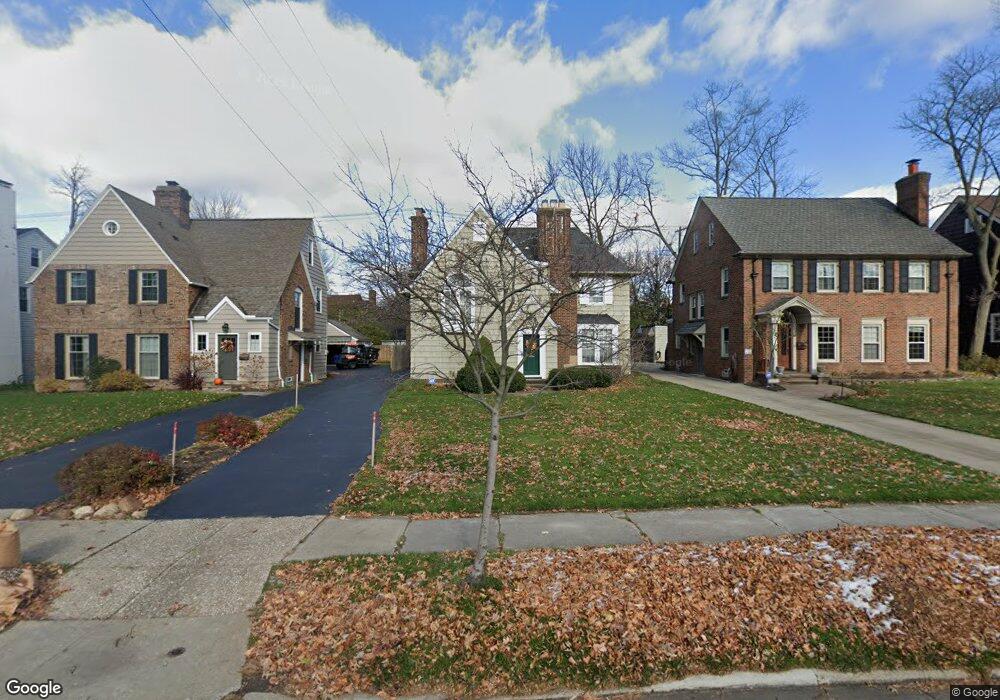
16821 Fernway Rd Cleveland, OH 44120
Estimated Value: $332,000 - $413,000
3
Beds
2
Baths
1,980
Sq Ft
$190/Sq Ft
Est. Value
About This Home
This home is located at 16821 Fernway Rd, Cleveland, OH 44120 and is currently estimated at $376,505, approximately $190 per square foot. 16821 Fernway Rd is a home located in Cuyahoga County with nearby schools including Fernway Elementary School, Woodbury Elementary School, and Shaker Heights Middle School.
Ownership History
Date
Name
Owned For
Owner Type
Purchase Details
Closed on
May 21, 2010
Sold by
Morrow D Austin and Morrow Colleen R
Bought by
Clark Richard A and Clark Amelia K
Current Estimated Value
Home Financials for this Owner
Home Financials are based on the most recent Mortgage that was taken out on this home.
Original Mortgage
$175,750
Outstanding Balance
$117,749
Interest Rate
5.12%
Mortgage Type
New Conventional
Estimated Equity
$258,756
Purchase Details
Closed on
Jul 21, 1998
Sold by
Jones Timothy D
Bought by
Morrow D Austin
Home Financials for this Owner
Home Financials are based on the most recent Mortgage that was taken out on this home.
Original Mortgage
$97,200
Interest Rate
7.13%
Purchase Details
Closed on
Apr 26, 1996
Sold by
Manning Michael
Bought by
Jones Timothy D
Home Financials for this Owner
Home Financials are based on the most recent Mortgage that was taken out on this home.
Original Mortgage
$107,200
Interest Rate
7.91%
Mortgage Type
New Conventional
Purchase Details
Closed on
Jan 1, 1975
Bought by
Manning Michael and Manning Eileen B
Create a Home Valuation Report for This Property
The Home Valuation Report is an in-depth analysis detailing your home's value as well as a comparison with similar homes in the area
Home Values in the Area
Average Home Value in this Area
Purchase History
| Date | Buyer | Sale Price | Title Company |
|---|---|---|---|
| Clark Richard A | $185,000 | Barristers Title Agency | |
| Morrow D Austin | $121,500 | Chicago Title Insurance Comp | |
| Jones Timothy D | $134,000 | -- | |
| Manning Michael | -- | -- |
Source: Public Records
Mortgage History
| Date | Status | Borrower | Loan Amount |
|---|---|---|---|
| Open | Clark Richard A | $175,750 | |
| Previous Owner | Morrow D Austin | $97,200 | |
| Previous Owner | Jones Timothy D | $107,200 |
Source: Public Records
Tax History Compared to Growth
Tax History
| Year | Tax Paid | Tax Assessment Tax Assessment Total Assessment is a certain percentage of the fair market value that is determined by local assessors to be the total taxable value of land and additions on the property. | Land | Improvement |
|---|---|---|---|---|
| 2024 | $9,633 | $107,975 | $22,610 | $85,365 |
| 2023 | $8,798 | $78,120 | $18,410 | $59,710 |
| 2022 | $8,547 | $78,120 | $18,410 | $59,710 |
| 2021 | $8,518 | $78,120 | $18,410 | $59,710 |
| 2020 | $8,463 | $73,010 | $17,220 | $55,790 |
| 2019 | $8,341 | $208,600 | $49,200 | $159,400 |
| 2018 | $8,033 | $73,010 | $17,220 | $55,790 |
| 2017 | $8,009 | $66,260 | $15,610 | $50,650 |
| 2016 | $7,688 | $66,260 | $15,610 | $50,650 |
| 2015 | $7,255 | $66,260 | $15,610 | $50,650 |
| 2014 | $7,255 | $60,240 | $14,180 | $46,060 |
Source: Public Records
Map
Nearby Homes
- 17015 Fernway Rd
- 3315 Elsmere Rd
- 17419 Fernway Rd
- 3356 Daleford Rd
- 3336 Ardmore Rd
- 17007 Van Aken Blvd Unit 101
- 17007 Van Aken Blvd Unit 2
- 17007 Van Aken Blvd Unit 107
- 3296 Grenway Rd
- 3305 Enderby Rd
- 16005 Fernway Rd
- 16125 Parkland Dr
- 3378 Clayton Blvd
- 3345 Kenmore Rd
- 18100 S Woodland Rd
- 2980 Fontenay Rd
- 16100 Van Aken Blvd
- 2919 Sedgewick Rd
- 2945 Fontenay Rd
- 17010 Kenyon Rd
- 16817 Fernway Rd
- 16827 Fernway Rd
- 16811 Fernway Rd
- 17001 Fernway Rd
- 16807 Fernway Rd
- 17005 Fernway Rd
- 16826 Aldersyde Dr
- 16816 Aldersyde Dr
- 3255 Chalfant Rd
- 16801 Fernway Rd
- 17009 Fernway Rd
- 16900 Aldersyde Dr
- 16729 Fernway Rd
- 3260 Daleford Rd
- 3259 Chalfant Rd
- 16800 Aldersyde Dr
- 16910 Aldersyde Dr
- 3255 Daleford Rd
- 16723 Fernway Rd
- 17019 Fernway Rd