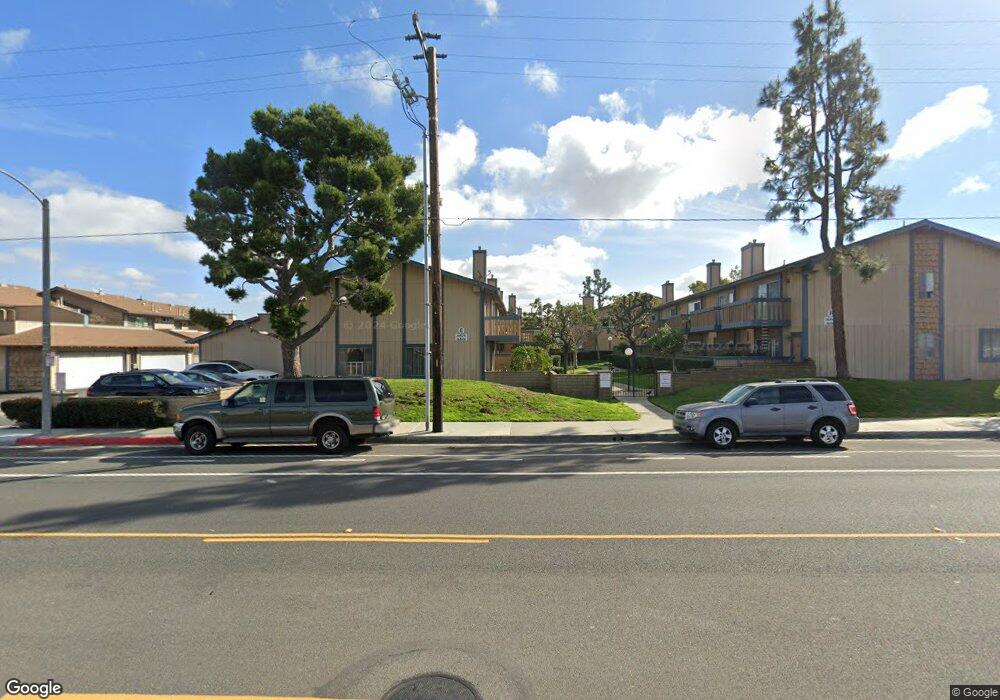
16828 Algonquin St Huntington Beach, CA 92649
Estimated Value: $764,000 - $891,000
3
Beds
3
Baths
1,486
Sq Ft
$543/Sq Ft
Est. Value
About This Home
This home is located at 16828 Algonquin St, Huntington Beach, CA 92649 and is currently estimated at $807,141, approximately $543 per square foot. 16828 Algonquin St is a home located in Orange County with nearby schools including Harbour View Elementary School, Marine View Middle, and Marina High School.
Ownership History
Date
Name
Owned For
Owner Type
Purchase Details
Closed on
Oct 1, 2024
Sold by
Michael D Nelson Revocable Trust and Nelson Michael D
Bought by
Michael D Nelson Revocable Trust and Nelson
Current Estimated Value
Purchase Details
Closed on
Feb 28, 2024
Sold by
Michael D Nelson Revocable Trust
Bought by
Michael D Nelson Revocable Trust and Nelson
Purchase Details
Closed on
Jan 11, 2023
Sold by
Michael D Nelson Revocable Trust
Bought by
Michael D Nelson Revocable Trust
Purchase Details
Closed on
May 8, 2017
Sold by
Nelson Michael D
Bought by
Nelson Michael D and Michael D Nelson Revocable Trust
Purchase Details
Closed on
Sep 4, 2009
Sold by
Nelson Michael D
Bought by
Nelson Michael D and The Michael D Nelson Revocable Trust
Purchase Details
Closed on
Dec 16, 2005
Sold by
Nelson Michael D
Bought by
Nelson Michael D and The Michael D Nelson Revocable Trust
Purchase Details
Closed on
Dec 13, 2005
Sold by
Marshall Julie R and Woodward Julie R
Bought by
Nelson Michael D
Create a Home Valuation Report for This Property
The Home Valuation Report is an in-depth analysis detailing your home's value as well as a comparison with similar homes in the area
Home Values in the Area
Average Home Value in this Area
Purchase History
| Date | Buyer | Sale Price | Title Company |
|---|---|---|---|
| Michael D Nelson Revocable Trust | -- | None Listed On Document | |
| Michael D Nelson Revocable Trust | -- | None Listed On Document | |
| Michael D Nelson Revocable Trust | -- | -- | |
| Nelson Michael D | -- | None Available | |
| Nelson Michael D | -- | California Title Company | |
| Nelson Michael D | -- | -- | |
| Nelson Michael D | -- | -- |
Source: Public Records
Tax History Compared to Growth
Tax History
| Year | Tax Paid | Tax Assessment Tax Assessment Total Assessment is a certain percentage of the fair market value that is determined by local assessors to be the total taxable value of land and additions on the property. | Land | Improvement |
|---|---|---|---|---|
| 2025 | $1,685 | $128,074 | $58,252 | $69,822 |
| 2024 | $1,685 | $125,563 | $57,110 | $68,453 |
| 2023 | $1,642 | $123,101 | $55,990 | $67,111 |
| 2022 | $1,612 | $120,688 | $54,892 | $65,796 |
| 2021 | $1,583 | $118,322 | $53,816 | $64,506 |
| 2020 | $1,565 | $117,109 | $53,264 | $63,845 |
| 2019 | $1,541 | $114,813 | $52,219 | $62,594 |
| 2018 | $1,508 | $112,562 | $51,195 | $61,367 |
| 2017 | $1,484 | $110,355 | $50,191 | $60,164 |
| 2016 | $1,430 | $108,192 | $49,207 | $58,985 |
| 2015 | $1,407 | $106,567 | $48,468 | $58,099 |
| 2014 | $1,378 | $104,480 | $47,519 | $56,961 |
Source: Public Records
Map
Nearby Homes
- 16734 Algonquin St Unit 6
- 16766 Sims Ln
- 16642 Algonquin St
- 4561 Warner Ave Unit 101
- 4822 Neely Cir
- 16511 Caballero Dr
- 16771 Green Ln
- 4648 Vista Bahia Dr Unit 16
- 4232 Calhoun Dr
- 4682 Warner Ave Unit B102
- 17108 Sims Ln
- 4831 Lago Dr Unit 102
- 16512 Blackbeard Ln Unit 200
- 4382 Lahaina Dr
- 4861 Lago Dr Unit 206
- 4852 Cabana Dr Unit 202
- 4822 Tiara Dr Unit 104
- 16451 Makaha Ln
- 16408 Vista Roma Cir Unit 116
- 16396 Vista Roma Cir Unit 111
- 16830 Algonquin St Unit 47
- 16826 Algonquin St Unit 49
- 16824 Algonquin St
- 16822 Algonquin St Unit 51
- 16822 Algonquin St
- 16862 Algonquin St
- 16820 Algonquin St Unit 52
- 16820 Algonquin St
- 16868 Algonquin St Unit 46
- 16866 Algonquin St Unit 45
- 16864 Algonquin St
- 16858 Algonquin St Unit 41
- 16858 Algonquin St
- 16860 Algonquin St Unit 42
- 16818 Algonquin St
- 16844 Algonquin St Unit 34
- 16816 Algonquin St
- 16856 Algonquin St
- 16842 Algonquin St
- 16814 Algonquin St