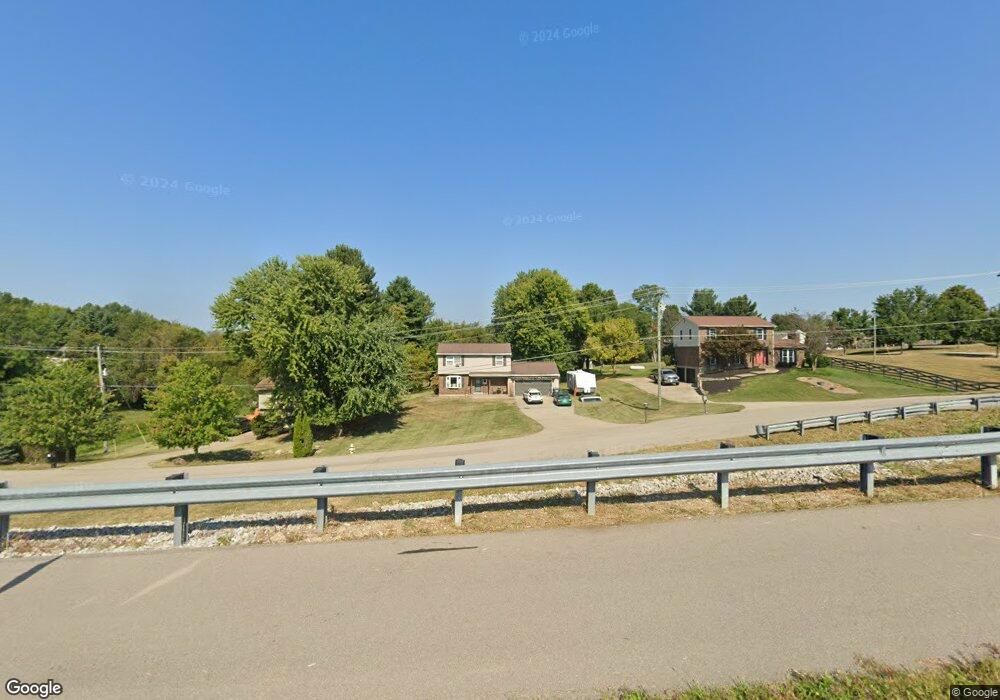
1683 Graves Rd Hebron, KY 41048
Estimated Value: $298,000 - $336,000
3
Beds
3
Baths
1,568
Sq Ft
$202/Sq Ft
Est. Value
About This Home
This home is located at 1683 Graves Rd, Hebron, KY 41048 and is currently estimated at $316,621, approximately $201 per square foot. 1683 Graves Rd is a home located in Boone County with nearby schools including Thornwilde Elementary School, Conner Middle School, and Conner High School.
Ownership History
Date
Name
Owned For
Owner Type
Purchase Details
Closed on
Nov 27, 2007
Sold by
Thompson Phillip James
Bought by
Sebastian Lisa M
Current Estimated Value
Purchase Details
Closed on
Jul 25, 2007
Sold by
Brown Robert
Bought by
Sebastian Lisa M and Thompson Phillip James
Home Financials for this Owner
Home Financials are based on the most recent Mortgage that was taken out on this home.
Original Mortgage
$147,250
Interest Rate
11.45%
Mortgage Type
Adjustable Rate Mortgage/ARM
Purchase Details
Closed on
Nov 27, 2002
Sold by
Peare George W
Bought by
Brown Robert
Purchase Details
Closed on
Jul 30, 2002
Sold by
H A D Llc
Bought by
Brown Robert W
Purchase Details
Closed on
Oct 2, 2000
Sold by
Charles V Beacom
Bought by
George W Peare
Home Financials for this Owner
Home Financials are based on the most recent Mortgage that was taken out on this home.
Original Mortgage
$109,953
Interest Rate
7.92%
Mortgage Type
New Conventional
Create a Home Valuation Report for This Property
The Home Valuation Report is an in-depth analysis detailing your home's value as well as a comparison with similar homes in the area
Home Values in the Area
Average Home Value in this Area
Purchase History
| Date | Buyer | Sale Price | Title Company |
|---|---|---|---|
| Sebastian Lisa M | $118,700 | Advanedced Land Title Agency | |
| Sebastian Lisa M | $135,000 | None Available | |
| Brown Robert | $112,905 | -- | |
| Brown Robert W | $15,000 | -- | |
| George W Peare | $120,000 | -- |
Source: Public Records
Mortgage History
| Date | Status | Borrower | Loan Amount |
|---|---|---|---|
| Previous Owner | Sebastian Lisa M | $147,250 | |
| Previous Owner | George W Peare | $109,953 |
Source: Public Records
Tax History
| Year | Tax Paid | Tax Assessment Tax Assessment Total Assessment is a certain percentage of the fair market value that is determined by local assessors to be the total taxable value of land and additions on the property. | Land | Improvement |
|---|---|---|---|---|
| 2025 | $1,874 | $170,100 | $30,000 | $140,100 |
| 2024 | $1,506 | $137,800 | $30,000 | $107,800 |
| 2023 | $1,472 | $137,800 | $30,000 | $107,800 |
| 2022 | $1,478 | $137,800 | $30,000 | $107,800 |
| 2021 | $1,551 | $137,800 | $30,000 | $107,800 |
| 2020 | $1,503 | $137,800 | $30,000 | $107,800 |
| 2019 | $1,515 | $137,800 | $30,000 | $107,800 |
| 2018 | $1,566 | $137,800 | $30,000 | $107,800 |
| 2017 | $1,502 | $137,800 | $30,000 | $107,800 |
| 2015 | $1,461 | $135,000 | $0 | $135,000 |
| 2013 | -- | $135,000 | $0 | $135,000 |
Source: Public Records
Map
Nearby Homes
- 2656 Timberside Dr
- 2686 Timberside Dr
- 2666 Timberside Dr
- 2678 Timberside Dr
- 2617 Timberside Dr
- 2670 Timberside Dr
- 2682 Timberside Dr
- 2674 Timberside Dr
- 2690 Timberside Dr
- 1551 Brenden Ct
- 2201 Ridgeline Dr
- 1547 Brenden Ct
- 1543 Brenden Ct
- 1644 Creekwood Ct
- 1580 Brenden Ct
- 2145 Ridgeline Dr
- 1560 Brenden Ct
- 2141 Ridgeline Dr
- 2609 Timberside Dr
- 2453 Rivers Pointe Dr
- 1689 Graves Rd
- 1677 Graves Rd
- 1663 Graves Rd
- 1573 N Bend Rd
- 1721 Graves Rd
- 1731 Graves Rd
- 1565 N Bend Rd
- 0 N Bend Rd
- 0 N Bend Rd Unit 208575
- 0 N Bend Rd Unit 259205
- 0 N Bend Rd Unit 381704
- 1549 N Bend Rd
- 1754 Graves Rd
- 1533 N Bend Rd
- 1576 N Bend Rd
- 1576 Old N Bend Rd
- 1542 N Bend Rd
- 1584 Old N Bend Rd
- 1584 Old N Bend Rd
- 1584 N Bend Rd
Your Personal Tour Guide
Ask me questions while you tour the home.