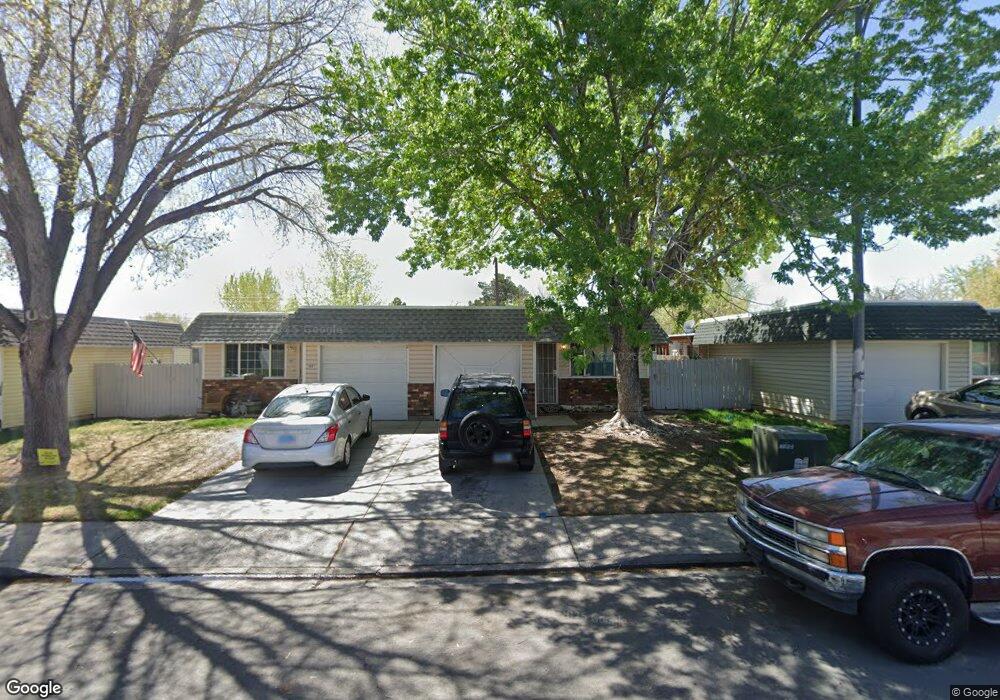
1683 Sue Way Unit C Sparks, NV 89431
North Rock NeighborhoodEstimated Value: $305,696 - $329,000
3
Beds
2
Baths
1,048
Sq Ft
$299/Sq Ft
Est. Value
About This Home
This home is located at 1683 Sue Way Unit C, Sparks, NV 89431 and is currently estimated at $313,674, approximately $299 per square foot. 1683 Sue Way Unit C is a home located in Washoe County with nearby schools including Alice Maxwell Elementary School, Sparks Middle School, and Sparks High School.
Ownership History
Date
Name
Owned For
Owner Type
Purchase Details
Closed on
Mar 19, 2019
Sold by
Fisher G Mark and Fisher Christine
Bought by
Limble Llc
Current Estimated Value
Purchase Details
Closed on
Apr 10, 2009
Sold by
Wells Fargo Financial Nevada 2 Inc
Bought by
Waysue Llc
Purchase Details
Closed on
Oct 9, 2008
Sold by
Garcia Jorge Ramirez and Ramirez Maria S
Bought by
Wells Fargo Financial Nevada 2 Inc
Purchase Details
Closed on
Feb 25, 2000
Sold by
Brown Betty Akert
Bought by
Garcia Jorge Ramirez and Garcia Maria S
Home Financials for this Owner
Home Financials are based on the most recent Mortgage that was taken out on this home.
Original Mortgage
$80,750
Interest Rate
8.16%
Purchase Details
Closed on
Mar 21, 1997
Sold by
Brown Betty Akert
Bought by
Brown Betty Akert and Betty Akert Brown Living Trust
Create a Home Valuation Report for This Property
The Home Valuation Report is an in-depth analysis detailing your home's value as well as a comparison with similar homes in the area
Home Values in the Area
Average Home Value in this Area
Purchase History
| Date | Buyer | Sale Price | Title Company |
|---|---|---|---|
| Limble Llc | -- | None Available | |
| Fisher G Mark | -- | None Available | |
| Waysue Llc | $47,000 | First American Title Reno | |
| Wells Fargo Financial Nevada 2 Inc | $124,000 | Ticor Title Of Nevada Inc | |
| Garcia Jorge Ramirez | $85,000 | First American Title | |
| Brown Betty Akert | -- | -- |
Source: Public Records
Mortgage History
| Date | Status | Borrower | Loan Amount |
|---|---|---|---|
| Previous Owner | Garcia Jorge Ramirez | $80,750 |
Source: Public Records
Tax History Compared to Growth
Tax History
| Year | Tax Paid | Tax Assessment Tax Assessment Total Assessment is a certain percentage of the fair market value that is determined by local assessors to be the total taxable value of land and additions on the property. | Land | Improvement |
|---|---|---|---|---|
| 2025 | $565 | $40,232 | $27,370 | $12,862 |
| 2024 | $565 | $38,794 | $25,830 | $12,964 |
| 2023 | $549 | $33,815 | $22,645 | $11,170 |
| 2022 | $528 | $27,945 | $18,480 | $9,465 |
| 2021 | $518 | $21,111 | $11,830 | $9,281 |
| 2020 | $501 | $21,525 | $11,830 | $9,695 |
| 2019 | $487 | $21,794 | $12,040 | $9,754 |
| 2018 | $473 | $17,196 | $7,350 | $9,846 |
| 2017 | $459 | $16,572 | $6,720 | $9,852 |
| 2016 | $448 | $15,778 | $5,495 | $10,283 |
| 2015 | $116 | $15,221 | $4,445 | $10,776 |
| 2014 | $433 | $13,589 | $3,045 | $10,544 |
| 2013 | -- | $13,112 | $2,415 | $10,697 |
Source: Public Records
Map
Nearby Homes
- 1731 Gault Way Unit D
- 1620 Gault Way
- 1595 York Way
- 0 N Mccarran Blvd Unit 250052909
- 1345 Plymouth Way
- 2154 Oppio St
- 1799 Vance Way
- 1125 Dodson Way
- 1160 York Way
- 1655 Byrd Dr
- 1110 Xman Way
- 3269 Valley Forge Way
- 1780 Greenbrae Dr
- 1124 Sbragia Way
- 3116 Sterling Ridge Cir
- 3516 Brassie Dr
- 5530 High Rock Way
- 3230 Creekside Ln Unit 1
- 1365 Prospect Ave
- 1121 Greenbrae Dr
- 1675 Sue Way Unit 8
- 1673 Sue Way Unit B
- 1681 Sue Way Unit D
- 1667 Sue Way Unit C
- 1665 Sue Way
- 1693 Sue Way
- 1670 Plymouth Way
- 1660 Plymouth Way
- 1657 Sue Way
- 1695 Sue Way
- 1655 Sue Way Unit B
- 1680 Plymouth Way
- 1703 Sue Way
- 1676 Sue Way
- 1640 Plymouth Way
- 1678 Sue Way
- 1701 Sue Way
- 1670 Sue Way Unit A
- 1696 Sue Way
- 1684 Sue Way Unit A