Estimated Value: $329,000 - $342,000
3
Beds
3
Baths
1,620
Sq Ft
$206/Sq Ft
Est. Value
About This Home
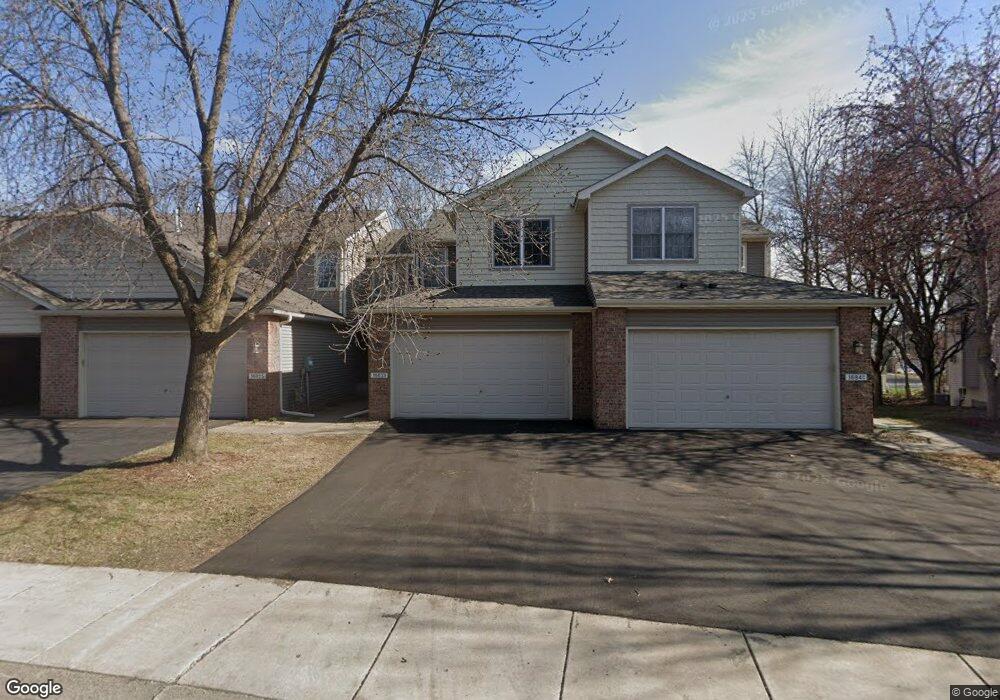
This home is located at 16833 79th Ave N, Osseo, MN 55311 and is currently estimated at $333,270, approximately $205 per square foot. 16833 79th Ave N is a home located in Hennepin County with nearby schools including Rush Creek Elementary School, Maple Grove Middle School, and Maple Grove Senior High School.
Ownership History
Date
Name
Owned For
Owner Type
Purchase Details
Closed on
Sep 28, 2010
Sold by
Cruikshank Matthew R and Cruikshank Cristin
Bought by
Kostetsky Artyom
Current Estimated Value
Purchase Details
Closed on
Apr 24, 2003
Sold by
Bunting Gwen L
Bought by
Cruikshank Matthew R
Purchase Details
Closed on
Oct 31, 2002
Sold by
Leith Kathleen J
Bought by
Bunting Gwen L
Purchase Details
Closed on
Apr 27, 2000
Sold by
Hart Kenneth M and Hart Marjory J
Bought by
Leith Kathleen J
Purchase Details
Closed on
Dec 22, 1998
Sold by
Town & Country Homes
Bought by
Hart Kenneth M and Hart Marjory J
Create a Home Valuation Report for This Property
The Home Valuation Report is an in-depth analysis detailing your home's value as well as a comparison with similar homes in the area
Home Values in the Area
Average Home Value in this Area
Purchase History
| Date | Buyer | Sale Price | Title Company |
|---|---|---|---|
| Kostetsky Artyom | $167,500 | -- | |
| Cruikshank Matthew R | $209,900 | -- | |
| Bunting Gwen L | $197,000 | -- | |
| Leith Kathleen J | $169,000 | -- | |
| Hart Kenneth M | $156,649 | -- |
Source: Public Records
Tax History
| Year | Tax Paid | Tax Assessment Tax Assessment Total Assessment is a certain percentage of the fair market value that is determined by local assessors to be the total taxable value of land and additions on the property. | Land | Improvement |
|---|---|---|---|---|
| 2024 | $3,835 | $328,900 | $58,300 | $270,600 |
| 2023 | $3,673 | $319,800 | $46,700 | $273,100 |
| 2022 | $3,168 | $326,300 | $43,300 | $283,000 |
| 2021 | $3,032 | $271,600 | $31,600 | $240,000 |
| 2020 | $2,985 | $257,100 | $26,900 | $230,200 |
| 2019 | $2,926 | $242,100 | $26,600 | $215,500 |
| 2018 | $2,819 | $226,000 | $26,200 | $199,800 |
| 2017 | $2,787 | $205,500 | $32,000 | $173,500 |
| 2016 | $2,659 | $195,000 | $36,000 | $159,000 |
| 2015 | $2,582 | $185,600 | $29,000 | $156,600 |
| 2014 | -- | $175,400 | $41,000 | $134,400 |
Source: Public Records
Map
Nearby Homes
- 16750 78th Place N
- 16889 79th Ave N
- 16759 78th Ave N
- 16959 79th Ave N
- 16878 79th Place N
- 7976 Everest Ln N
- 17005 78th Place N
- 8008 Dunkirk Ln N
- 16506 78th Ave N
- 7684 Fountain Ln N
- 8111 Kimberly Ln N
- 17685 79th Place N
- 7200 Comstock Ln N
- 17532 82nd Ave N
- 16917 73rd Place N
- 8030 Narcissus Ln N
- 17818 77th Ave N
- 7336 Fountain Ln N
- 7472 Olive Ln N
- 17678 83rd Ave N
- 16825 79th Ave N
- 16841 79th Ave N
- 16817 79th Ave N
- 16849 79th Ave N
- 16809 79th Ave N
- 16817 16817 79th-Avenue-n
- 16857 79th Ave N
- 16801 79th Ave N
- 16801 16801 79th-Avenue-n
- 16774 78th Place N
- 16762 78th Place N
- 16786 78th Place N
- 16865 79th Ave N
- 16798 78th Place N
- 16738 78th Place N
- 16838 79th Ave N
- 7900 Everest Ln N
- 16816 79th Ave N
- 16810 78th Place N
- 16804 79th Ave N
Your Personal Tour Guide
Ask me questions while you tour the home.