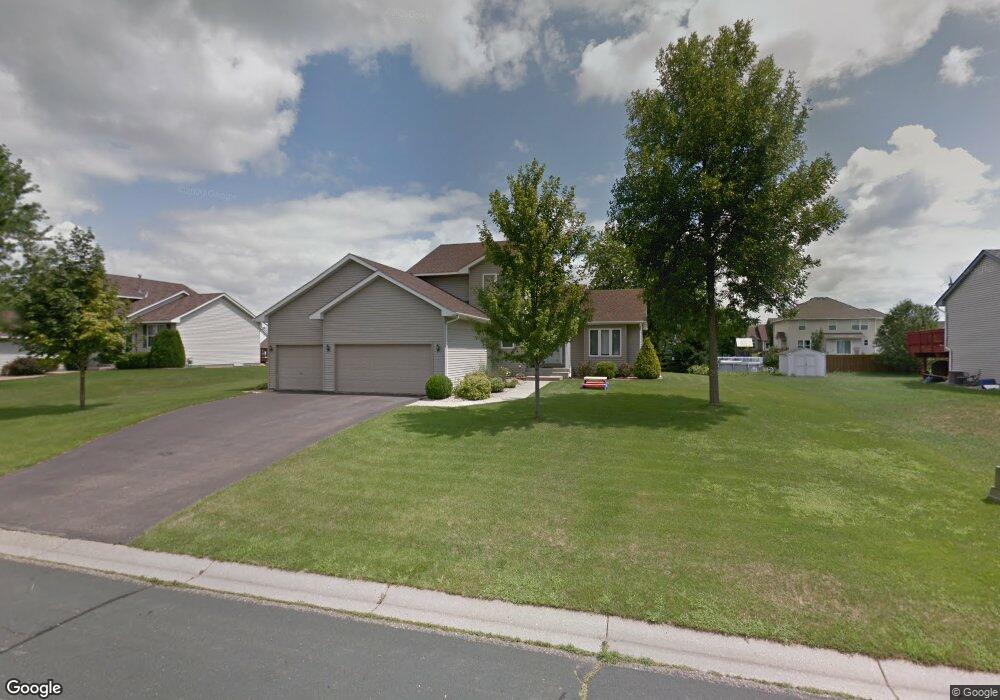
16834 Fieldcrest Ave Farmington, MN 55024
Estimated Value: $491,000 - $509,000
4
Beds
3
Baths
2,106
Sq Ft
$237/Sq Ft
Est. Value
About This Home
This home is located at 16834 Fieldcrest Ave, Farmington, MN 55024 and is currently estimated at $499,515, approximately $237 per square foot. 16834 Fieldcrest Ave is a home located in Dakota County with nearby schools including Parkview Elementary School, Scott Highlands Middle School, and Rosemount Senior High School.
Ownership History
Date
Name
Owned For
Owner Type
Purchase Details
Closed on
Oct 16, 2019
Sold by
Olijnek Carolyn K and Olijnek Lance A
Bought by
Igou Callie Mae and Igou Jason Thomas
Current Estimated Value
Home Financials for this Owner
Home Financials are based on the most recent Mortgage that was taken out on this home.
Original Mortgage
$331,200
Outstanding Balance
$290,739
Interest Rate
3.6%
Mortgage Type
New Conventional
Estimated Equity
$208,776
Purchase Details
Closed on
Apr 3, 1998
Sold by
Natvig Jon B and Natvig Cynthia K
Bought by
Olijnek Carolyn K and Olijnek Lance
Purchase Details
Closed on
Nov 22, 1996
Sold by
Parish Marketing & Development Inc
Bought by
Natvig Jon B and Natvig Cynthia K
Purchase Details
Closed on
Aug 28, 1996
Sold by
Lyman Lumber Of Wisconsin
Bought by
Natvig Jon B
Create a Home Valuation Report for This Property
The Home Valuation Report is an in-depth analysis detailing your home's value as well as a comparison with similar homes in the area
Home Values in the Area
Average Home Value in this Area
Purchase History
| Date | Buyer | Sale Price | Title Company |
|---|---|---|---|
| Igou Callie Mae | $368,000 | Edina Realty Title Inc | |
| Olijnek Carolyn K | $168,000 | -- | |
| Natvig Jon B | $154,075 | -- | |
| Natvig Jon B | $37,900 | -- |
Source: Public Records
Mortgage History
| Date | Status | Borrower | Loan Amount |
|---|---|---|---|
| Open | Igou Callie Mae | $331,200 |
Source: Public Records
Tax History Compared to Growth
Tax History
| Year | Tax Paid | Tax Assessment Tax Assessment Total Assessment is a certain percentage of the fair market value that is determined by local assessors to be the total taxable value of land and additions on the property. | Land | Improvement |
|---|---|---|---|---|
| 2024 | $4,812 | $443,700 | $91,900 | $351,800 |
| 2023 | $4,812 | $456,100 | $91,600 | $364,500 |
| 2022 | $4,092 | $451,600 | $91,300 | $360,300 |
| 2021 | $3,946 | $376,000 | $79,400 | $296,600 |
| 2020 | $3,928 | $351,200 | $75,600 | $275,600 |
| 2019 | $3,678 | $340,300 | $72,000 | $268,300 |
| 2018 | $3,482 | $333,900 | $68,600 | $265,300 |
| 2017 | $3,427 | $309,000 | $65,300 | $243,700 |
| 2016 | $3,399 | $291,400 | $62,200 | $229,200 |
| 2015 | $3,273 | $272,429 | $57,823 | $214,606 |
| 2014 | -- | $264,908 | $56,097 | $208,811 |
| 2013 | -- | $241,800 | $50,816 | $190,984 |
Source: Public Records
Map
Nearby Homes
- 17126 Firtree Place
- 16563 Fishing Ave W
- 6649 167th St W
- 6678 166th St W
- 17415 Fireside Ln
- 16546 Foliage Ave W
- 6656 Gerdine Path W
- 6634 162nd Ct Unit 421
- 6882 173rd St W
- 16123 Flagstaff Ct N
- 16793 Embers Ave Unit 606
- 16809 Embers Ave Unit 702
- 16895 Embers Ave
- 17373 N Creek Dr
- 17583 Foxboro Ln
- 16770 Embers Ave
- 16660 Garland Way W
- 6744 Foliage Ct W
- 7130 167th Ct W
- 16424 Elm Creek Ln Unit 4029
- 16814 Fieldcrest Ave
- 16856 Fieldcrest Ave
- 16811 Festal Ave
- 16791 Festal Ave
- 16831 Festal Ave
- 16771 Festal Ave
- 16796 Fieldcrest Ave
- 16833 16833 Fieldcrest-Avenue-
- 16833 Fieldcrest Ave
- 6299 169th St W
- 16813 Fieldcrest Ave
- 16749 Festal Ave
- 16902 Fieldcrest Ave
- 16795 Fieldcrest Ave
- 16776 Fieldcrest Ave
- 6317 169th St W
- 16917 Festal Ave
- 16810 Festal Ave
- 16790 Festal Ave
- 16723 Festal Ave