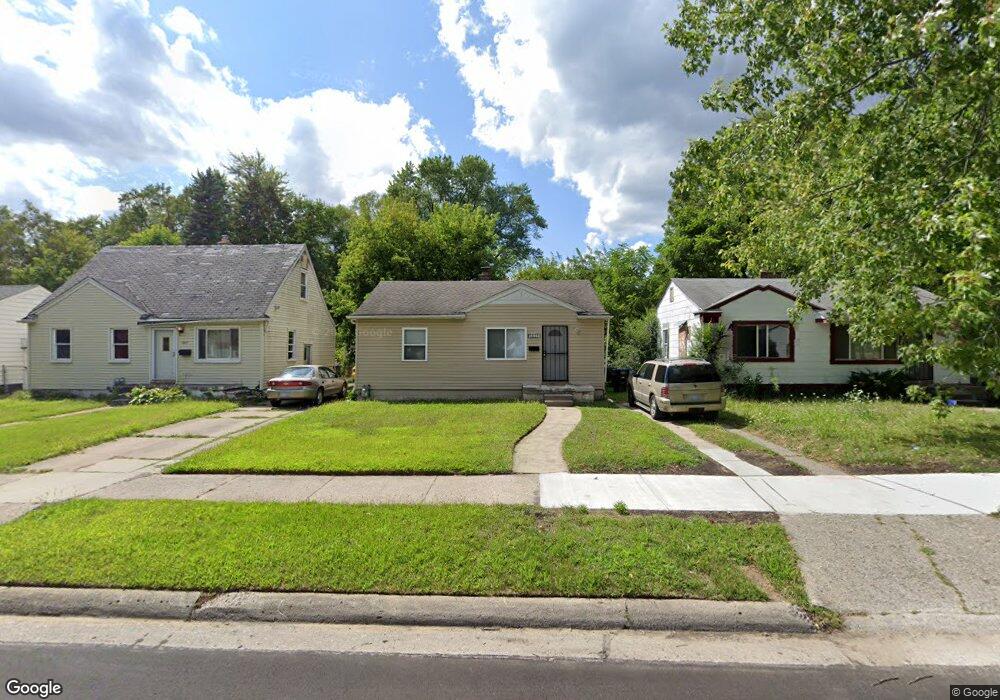
16843 Fenton St Detroit, MI 48219
Estimated Value: $50,000 - $88,000
2
Beds
1
Bath
1,000
Sq Ft
$70/Sq Ft
Est. Value
About This Home
This home is located at 16843 Fenton St, Detroit, MI 48219 and is currently estimated at $70,198, approximately $70 per square foot. 16843 Fenton St is a home located in Wayne County with nearby schools including Ralph W. Emerson Elementary-Middle School, Charles L. Spain Elementary-Middle School, and Edward 'Duke' Ellington Conservatory of Music and Art.
Ownership History
Date
Name
Owned For
Owner Type
Purchase Details
Closed on
Feb 28, 2014
Sold by
Rc Squared Llc
Bought by
Longhorn Llc
Current Estimated Value
Purchase Details
Closed on
Nov 7, 2013
Sold by
Wayne County Treasurer
Bought by
Rc Squared Llc
Purchase Details
Closed on
Nov 13, 2012
Sold by
5 Eagle Limited
Bought by
Greater Faith Assembly
Purchase Details
Closed on
Aug 20, 2009
Sold by
Land Of Liberty Llc
Bought by
5 Eagle Limited
Purchase Details
Closed on
Dec 29, 2008
Sold by
Smith Crystal
Bought by
Land Of Liberty Llc
Purchase Details
Closed on
Jun 3, 2008
Sold by
Hanes Capital Enterprises Inc
Bought by
Smith Crystal
Purchase Details
Closed on
Jan 18, 2007
Sold by
Weathers Steven
Bought by
Lasalle Bank Na
Purchase Details
Closed on
Jan 13, 2006
Sold by
Gilman Kevin and Gilman Angelita
Bought by
Weathers Steven
Purchase Details
Closed on
Aug 27, 2003
Sold by
Hud
Bought by
Gilman Kevin
Create a Home Valuation Report for This Property
The Home Valuation Report is an in-depth analysis detailing your home's value as well as a comparison with similar homes in the area
Home Values in the Area
Average Home Value in this Area
Purchase History
| Date | Buyer | Sale Price | Title Company |
|---|---|---|---|
| Longhorn Llc | $4,000 | None Available | |
| Rc Squared Llc | $3,600 | None Available | |
| Greater Faith Assembly | -- | None Available | |
| 5 Eagle Limited | -- | None Available | |
| Land Of Liberty Llc | -- | None Available | |
| Smith Crystal | -- | First Centennial Title Inc | |
| Lasalle Bank Na | $61,125 | None Available | |
| Weathers Steven | $76,000 | Abstract Title Agency | |
| Gilman Kevin | $37,766 | -- |
Source: Public Records
Tax History Compared to Growth
Tax History
| Year | Tax Paid | Tax Assessment Tax Assessment Total Assessment is a certain percentage of the fair market value that is determined by local assessors to be the total taxable value of land and additions on the property. | Land | Improvement |
|---|---|---|---|---|
| 2025 | $917 | $29,000 | $0 | $0 |
| 2024 | $917 | $24,500 | $0 | $0 |
| 2023 | $889 | $19,100 | $0 | $0 |
| 2022 | $433 | $15,900 | $0 | $0 |
| 2021 | $919 | $13,300 | $0 | $0 |
| 2020 | $919 | $11,500 | $0 | $0 |
| 2019 | $906 | $9,000 | $0 | $0 |
| 2018 | $806 | $7,700 | $0 | $0 |
| 2017 | $137 | $7,200 | $0 | $0 |
| 2016 | $781 | $18,700 | $0 | $0 |
| 2015 | $607 | $18,700 | $0 | $0 |
| 2013 | $1,866 | $18,655 | $0 | $0 |
| 2010 | -- | $26,729 | $1,000 | $25,729 |
Source: Public Records
Map
Nearby Homes
- 24451 W McNichols Rd
- 16618 Salem St
- 16580 Winston St
- 16599 Lenore
- 16865 Five Points St
- 17167 Salem St
- 16580 Five Points St
- 16520 Lenore
- 17175 Five Points St
- 17334 Winston St
- 16183 Salem St
- 17317 Brady
- 16124 Wormer St
- 17465 Fenton St
- 15869 Wormer
- 24478 Pilgrim
- 17664 Winston St
- 17648 Wormer St
- 17684 Fenton St
- 15861 Knight
- 16851 Fenton St
- 16837 Fenton St
- 16863 Fenton St
- 16831 Fenton St
- 16873 Fenton St
- 16821 Fenton St
- 16844 Winston St
- 16836 Winston St
- 16860 Winston St
- 16881 Fenton St
- 16811 Fenton St
- 16868 Winston St
- 16832 Winston St
- 16824 Winston St
- 16874 Winston St
- 16801 Fenton St
- 16846 Fenton St
- 16840 Fenton St
- 16856 Fenton St
- 16814 Winston St