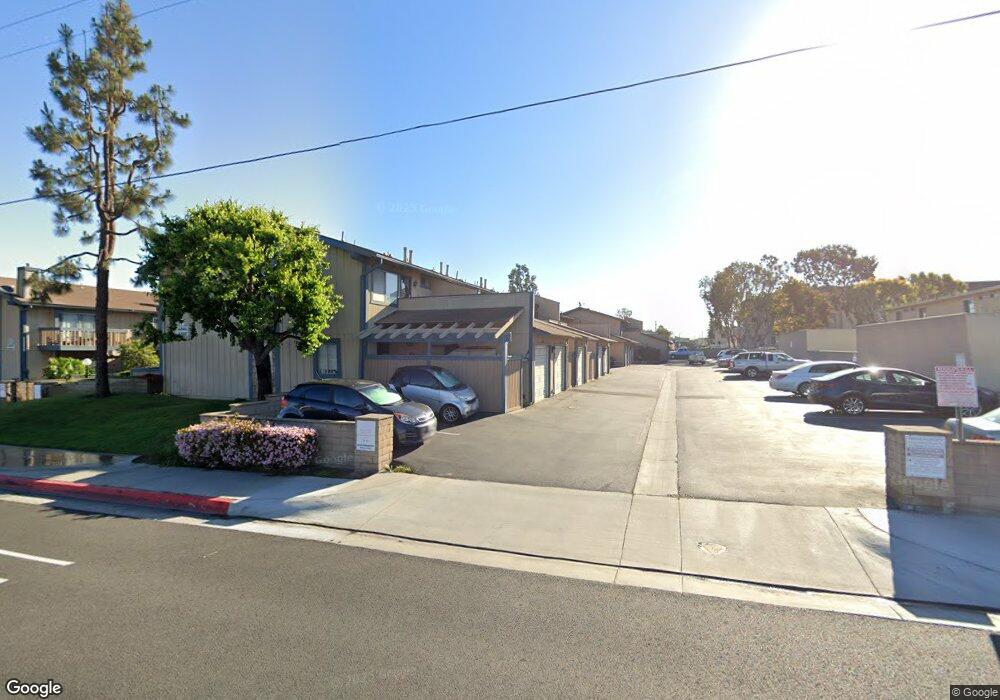
16848 Algonquin St Huntington Beach, CA 92649
Estimated Value: $646,161 - $777,000
2
Beds
3
Baths
1,118
Sq Ft
$650/Sq Ft
Est. Value
About This Home
This home is located at 16848 Algonquin St, Huntington Beach, CA 92649 and is currently estimated at $726,790, approximately $650 per square foot. 16848 Algonquin St is a home located in Orange County with nearby schools including Harbour View Elementary School, Marine View Middle, and Marina High School.
Ownership History
Date
Name
Owned For
Owner Type
Purchase Details
Closed on
Sep 3, 2013
Sold by
Baslisalisa Natalie and Martin James Michael
Bought by
Balisalisa Joseph C and Balisalisa Natalie
Current Estimated Value
Home Financials for this Owner
Home Financials are based on the most recent Mortgage that was taken out on this home.
Original Mortgage
$300,000
Outstanding Balance
$224,664
Interest Rate
4.49%
Mortgage Type
New Conventional
Estimated Equity
$502,126
Purchase Details
Closed on
Jul 1, 2009
Sold by
Rubsamen Anne S
Bought by
Martin Natalie Ann and Martin James Michael
Home Financials for this Owner
Home Financials are based on the most recent Mortgage that was taken out on this home.
Original Mortgage
$313,390
Interest Rate
5.09%
Mortgage Type
FHA
Purchase Details
Closed on
Nov 12, 2005
Sold by
Rubsamen Anne S
Bought by
Rubsamen Anne S and Anne Stanton Rubsamen Revocable Trust
Purchase Details
Closed on
Nov 20, 2001
Sold by
Perreten Anne S
Bought by
Rubsamen Anne S
Home Financials for this Owner
Home Financials are based on the most recent Mortgage that was taken out on this home.
Original Mortgage
$67,000
Interest Rate
6.57%
Create a Home Valuation Report for This Property
The Home Valuation Report is an in-depth analysis detailing your home's value as well as a comparison with similar homes in the area
Home Values in the Area
Average Home Value in this Area
Purchase History
| Date | Buyer | Sale Price | Title Company |
|---|---|---|---|
| Balisalisa Joseph C | -- | None Available | |
| Martin Natalie Ann | $385,000 | North American Title Co | |
| Rubsamen Anne S | -- | None Available | |
| Rubsamen Anne S | -- | First American Title Ins Co |
Source: Public Records
Mortgage History
| Date | Status | Borrower | Loan Amount |
|---|---|---|---|
| Open | Balisalisa Joseph C | $300,000 | |
| Previous Owner | Martin Natalie Ann | $313,390 | |
| Previous Owner | Rubsamen Anne S | $67,000 |
Source: Public Records
Tax History Compared to Growth
Tax History
| Year | Tax Paid | Tax Assessment Tax Assessment Total Assessment is a certain percentage of the fair market value that is determined by local assessors to be the total taxable value of land and additions on the property. | Land | Improvement |
|---|---|---|---|---|
| 2025 | $5,555 | $488,456 | $397,897 | $90,559 |
| 2024 | $5,555 | $478,879 | $390,095 | $88,784 |
| 2023 | $5,427 | $469,490 | $382,446 | $87,044 |
| 2022 | $5,345 | $460,285 | $374,947 | $85,338 |
| 2021 | $5,246 | $451,260 | $367,595 | $83,665 |
| 2020 | $5,187 | $446,633 | $363,825 | $82,808 |
| 2019 | $5,097 | $437,876 | $356,691 | $81,185 |
| 2018 | $4,983 | $429,291 | $349,697 | $79,594 |
| 2017 | $4,903 | $420,874 | $342,840 | $78,034 |
| 2016 | $4,703 | $412,622 | $336,118 | $76,504 |
| 2015 | $4,630 | $406,425 | $331,070 | $75,355 |
| 2014 | $4,260 | $372,550 | $299,887 | $72,663 |
Source: Public Records
Map
Nearby Homes
- 16734 Algonquin St Unit 6
- 4561 Warner Ave Unit 101
- 16766 Sims Ln
- 16642 Algonquin St
- 4682 Warner Ave Unit B102
- 17108 Sims Ln
- 4232 Calhoun Dr
- 16771 Green Ln
- 4822 Tiara Dr Unit 104
- 4822 Neely Cir
- 16511 Caballero Dr
- 17182 Hillside Cir
- 4648 Vista Bahia Dr Unit 16
- 4831 Lago Dr Unit 102
- 4651 Los Patos Ave
- 17212 Lynn Ln
- 4861 Lago Dr Unit 206
- 16512 Blackbeard Ln Unit 200
- 4382 Lahaina Dr
- 4852 Cabana Dr Unit 202
- 16850 Algonquin St Unit 37
- 16846 Algonquin St
- 16852 Algonquin St Unit 36
- 16852 Algonquin St
- 16854 Algonquin St Unit 35
- 16854 Algonquin St
- 16836 Algonquin St Unit 30
- 16834 Algonquin St Unit 29
- 16838 Algonquin St Unit 3
- 16840 Algonquin St Unit 32
- 16856 Algonquin St
- 16858 Algonquin St Unit 41
- 16858 Algonquin St
- 16842 Algonquin St
- 16844 Algonquin St Unit 34
- 16862 Algonquin St
- 16860 Algonquin St Unit 42
- 16864 Algonquin St
- 16866 Algonquin St Unit 45
- 16868 Algonquin St Unit 46