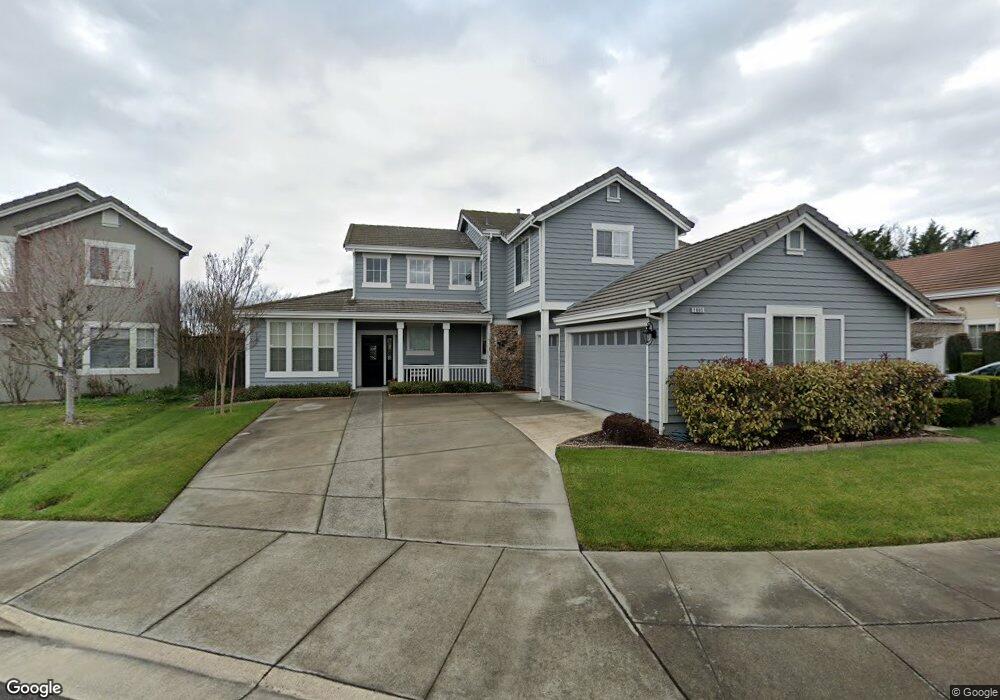
1685 Andover Way Petaluma, CA 94954
College Heights NeighborhoodEstimated Value: $1,289,008 - $1,386,000
5
Beds
3
Baths
3,079
Sq Ft
$430/Sq Ft
Est. Value
About This Home
This home is located at 1685 Andover Way, Petaluma, CA 94954 and is currently estimated at $1,324,752, approximately $430 per square foot. 1685 Andover Way is a home located in Sonoma County with nearby schools including Corona Creek Elementary School, Kenilworth Junior High School, and Casa Grande High School.
Ownership History
Date
Name
Owned For
Owner Type
Purchase Details
Closed on
Jun 16, 2016
Sold by
Revo Thompson Robert Charles and Revo Suzanne Swearing Thompson
Bought by
Lotspeich Ryan A and Lotspeich Nickole M
Current Estimated Value
Home Financials for this Owner
Home Financials are based on the most recent Mortgage that was taken out on this home.
Original Mortgage
$567,000
Outstanding Balance
$451,269
Interest Rate
3.57%
Mortgage Type
New Conventional
Estimated Equity
$873,483
Purchase Details
Closed on
Feb 5, 1998
Sold by
Swearingen Thompson Robert Charles and Swearingen Thompson Suzanne
Bought by
Thom Robert Charles and Thom Suzanne Swearingen
Purchase Details
Closed on
Jul 1, 1996
Sold by
Sonoma Parkway Company
Bought by
Swearingen Thompson Robert Charles and Swearingen Thompson Suzanne
Home Financials for this Owner
Home Financials are based on the most recent Mortgage that was taken out on this home.
Original Mortgage
$287,900
Interest Rate
8.25%
Create a Home Valuation Report for This Property
The Home Valuation Report is an in-depth analysis detailing your home's value as well as a comparison with similar homes in the area
Home Values in the Area
Average Home Value in this Area
Purchase History
| Date | Buyer | Sale Price | Title Company |
|---|---|---|---|
| Lotspeich Ryan A | $810,000 | Chicago Title Company | |
| Thom Robert Charles | -- | -- | |
| Swearingen Thompson Robert Charles | $320,000 | First American Title |
Source: Public Records
Mortgage History
| Date | Status | Borrower | Loan Amount |
|---|---|---|---|
| Open | Lotspeich Ryan A | $567,000 | |
| Previous Owner | Swearingen Thompson Robert Charles | $287,900 |
Source: Public Records
Tax History Compared to Growth
Tax History
| Year | Tax Paid | Tax Assessment Tax Assessment Total Assessment is a certain percentage of the fair market value that is determined by local assessors to be the total taxable value of land and additions on the property. | Land | Improvement |
|---|---|---|---|---|
| 2025 | $10,602 | $958,866 | $383,546 | $575,320 |
| 2024 | $10,602 | $940,066 | $376,026 | $564,040 |
| 2023 | $10,602 | $921,634 | $368,653 | $552,981 |
| 2022 | $10,379 | $903,564 | $361,425 | $542,139 |
| 2021 | $10,155 | $885,848 | $354,339 | $531,509 |
| 2020 | $10,225 | $876,766 | $350,706 | $526,060 |
| 2019 | $10,099 | $859,576 | $343,830 | $515,746 |
| 2018 | $10,107 | $842,723 | $337,089 | $505,634 |
| 2017 | $9,948 | $826,200 | $330,480 | $495,720 |
| 2016 | $5,519 | $431,491 | $114,648 | $316,843 |
| 2015 | $5,490 | $425,010 | $112,926 | $312,084 |
| 2014 | $5,443 | $416,685 | $110,714 | $305,971 |
Source: Public Records
Map
Nearby Homes
- 1418 Mauro Pietro Dr Unit 301
- 1757 Burgundy Ct
- 837 Vineyard Place
- 594 Sonoma Dr
- 829 Winton Dr
- 1544 Crown Rd
- 20 E Napa Dr
- 1548 Royal Oak Dr
- 36 N Napa Dr
- 1003 Sonoma Ct
- 365 Ely Rd N
- 518 Vina Rose Dr
- 288 Ely Rd N
- 1501 Florence Way
- 1463 Woodside Cir
- 1441 Woodside Cir
- 1407 Woodside Cir
- 116 Marvin Ct
- 628 Nikki Dr
- 717 N Mcdowell Blvd Unit 111
- 1689 Andover Way
- 1681 Andover Way
- 1693 Andover Way
- 1677 Andover Way
- 1672 Andover Way
- 1673 Andover Way
- 1697 Andover Way
- 941 Telford Ln
- 1669 Andover Way
- 1668 Andover Way
- 1714 Nora Ln
- 937 Telford Ln
- 1701 Andover Way
- 1665 Andover Way
- 1664 Andover Way
- 1661 Andover Way
- 1702 Andover Way
- 1660 Andover Way
- 929 Telford Ln