1685 Arch St Unit 2 Berkeley, CA 94709
North Berkeley NeighborhoodEstimated Value: $1,103,000
1
Bed
1
Bath
1,100
Sq Ft
$1,003/Sq Ft
Est. Value
About This Home
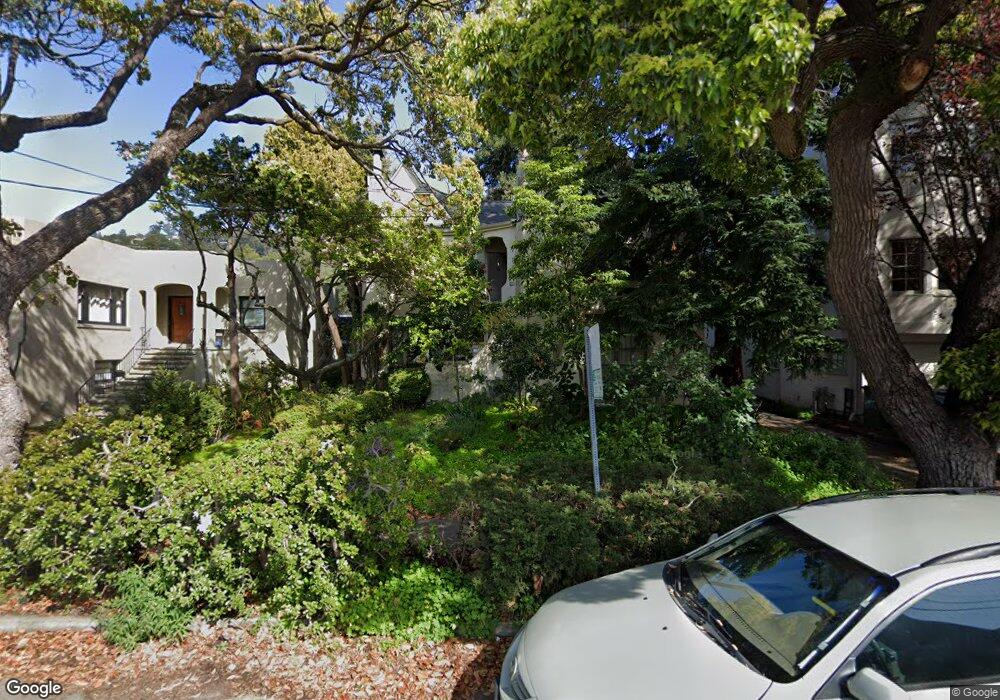
This home is located at 1685 Arch St Unit 2, Berkeley, CA 94709 and is currently estimated at $1,103,000, approximately $1,002 per square foot. 1685 Arch St Unit 2 is a home located in Alameda County with nearby schools including Berkeley Arts Magnet at Whittier School, Washington Elementary School, and Cragmont Elementary School.
Ownership History
Date
Name
Owned For
Owner Type
Purchase Details
Closed on
Jul 14, 2025
Sold by
Smith Dorothy E and Smith Bryan D
Bought by
Weil David and Weil Sahar
Current Estimated Value
Purchase Details
Closed on
Jul 14, 2022
Sold by
Peter J Claus Revocable Trust
Bought by
Zhang Maximilian
Purchase Details
Closed on
Oct 4, 2021
Sold by
Claus Matthew C and Peter J Claus Revocable Trust
Bought by
Zhang Maximilian
Purchase Details
Closed on
Sep 21, 2021
Sold by
Peter J Claus Revocable Trust and 2019 Carl F
Bought by
Peter J Claus Revocable Trust and 2019 Carl F Friberg And Annie F Friberg Revoc
Purchase Details
Closed on
Nov 11, 2019
Sold by
Friberg Carl F and Friberg Annie F
Bought by
Friberg Carl F and Friberg Annie F
Purchase Details
Closed on
Jul 27, 2010
Sold by
Friberg Carl F and Friberg Annie F
Bought by
Friberg Carl F and Annie F Friberg Irrevocable Tr
Purchase Details
Closed on
Sep 22, 2003
Sold by
Claus Peter J
Bought by
Claus Peter J and Peter J Claus Revocable Trust
Purchase Details
Closed on
Apr 20, 1994
Sold by
Friberg Carl F
Bought by
Friberg Carl F and Friberg Annie F
Purchase Details
Closed on
Apr 15, 1994
Sold by
Wang Plato
Bought by
Claus Peter J and Smith John B
Create a Home Valuation Report for This Property
The Home Valuation Report is an in-depth analysis detailing your home's value as well as a comparison with similar homes in the area
Home Values in the Area
Average Home Value in this Area
Purchase History
| Date | Buyer | Sale Price | Title Company |
|---|---|---|---|
| Weil David | $470,000 | Old Republic Title Company | |
| Smith Bryan D | -- | Old Republic Title Company | |
| Zhang Maximilian | $495,000 | -- | |
| Zhang Maximilian | $400,000 | Old Republic Title Company | |
| Peter J Claus Revocable Trust | -- | Accommodation/Courtesy Recordi | |
| Friberg Carl F | -- | None Available | |
| Friberg Carl F | -- | None Available | |
| Friberg Carl F | -- | None Available | |
| Friberg Carl F | -- | None Available | |
| Claus Peter J | -- | -- | |
| Friberg Carl F | -- | -- | |
| Claus Peter J | $30,000 | -- |
Source: Public Records
Tax History
| Year | Tax Paid | Tax Assessment Tax Assessment Total Assessment is a certain percentage of the fair market value that is determined by local assessors to be the total taxable value of land and additions on the property. | Land | Improvement |
|---|---|---|---|---|
| 2025 | $22,987 | $1,358,198 | $377,256 | $980,942 |
| 2024 | $22,987 | $1,331,570 | $369,859 | $961,711 |
| 2023 | $22,489 | $1,305,461 | $362,607 | $942,854 |
| 2022 | $16,226 | $1,002,480 | $260,895 | $741,585 |
| 2021 | $16,320 | $787,080 | $232,543 | $554,537 |
| 2020 | $15,082 | $779,010 | $230,159 | $548,851 |
| 2019 | $14,217 | $763,736 | $225,646 | $538,090 |
| 2018 | $13,924 | $748,763 | $221,222 | $527,541 |
| 2017 | $13,429 | $734,086 | $216,886 | $517,200 |
| 2016 | $12,828 | $719,694 | $212,634 | $507,060 |
| 2015 | $12,633 | $708,887 | $209,441 | $499,446 |
| 2014 | $12,694 | $695,002 | $205,339 | $489,663 |
Source: Public Records
Map
Nearby Homes
- 2365 Virginia St Unit 2
- 1622 Scenic Ave
- 2340 Virginia St
- 2477 Virginia St
- 2451 Le Conte Ave
- 1739 Spruce St
- 2201 Virginia St Unit 2
- 1682 Oxford St
- 1519 Oxford St Unit E
- 1471 Scenic Ave
- 2600 Hilgard Ave
- 2634 Virginia St Unit 13
- 1444 Walnut St
- 1698 La Loma Ave Unit 1698
- 1412 Oxford St
- 2700 Le Conte Ave Unit 301
- 2700 Le Conte Ave Unit 402
- 1400 Le Roy Ave
- 2501 Rose Walk
- 1440 Walnut St Unit 5
- 1685 Arch St Unit 4
- 1685 Arch St Unit 3
- 1685 Arch St
- 1677 Arch St
- 2301 Virginia St Unit 6
- 2301 Virginia St Unit 5
- 2301 Virginia St Unit 4
- 2301 Virginia St Unit 3
- 2301 Virginia St Unit 2
- 2301 Virginia St Unit 1
- 2301 Virginia St Unit 7
- 2303 Virginia St Unit 5
- 2311 Virginia St
- 2309 Virginia St
- 2340 Hilgard Ave
- 1657 Arch St
- 2355 Virginia St
- 2326 Hilgard Ave
- 2296 Virginia St
- 2324 Virginia St
Your Personal Tour Guide
Ask me questions while you tour the home.