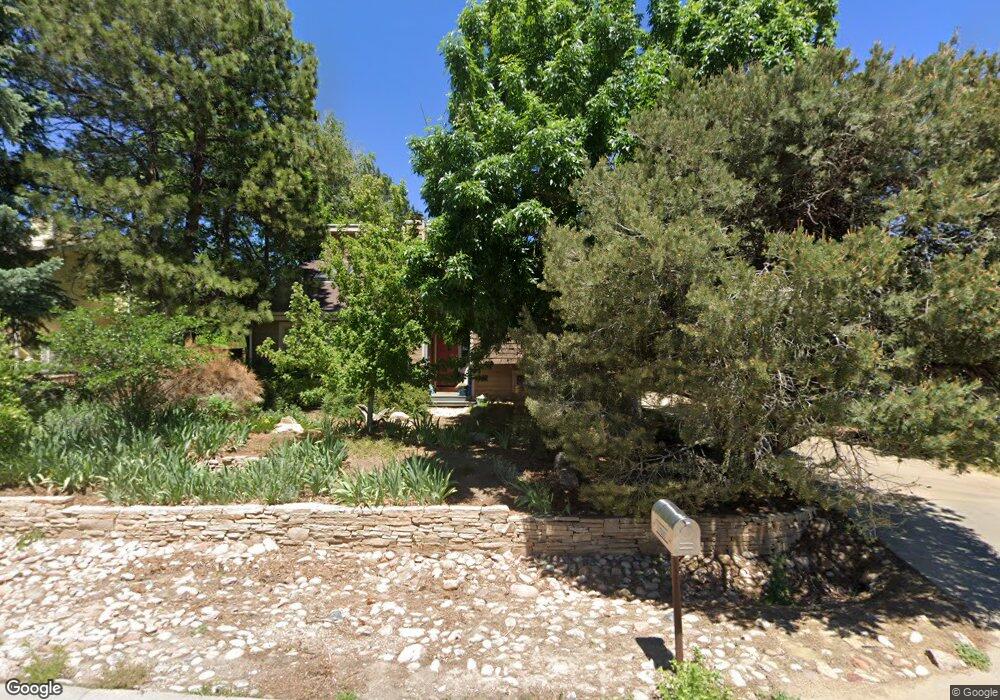
1685 Quince Ave Boulder, CO 80304
North Boulder NeighborhoodEstimated Value: $1,397,734 - $1,702,000
3
Beds
3
Baths
2,052
Sq Ft
$763/Sq Ft
Est. Value
About This Home
This home is located at 1685 Quince Ave, Boulder, CO 80304 and is currently estimated at $1,565,184, approximately $762 per square foot. 1685 Quince Ave is a home located in Boulder County with nearby schools including Crest View Elementary School, Centennial Middle School, and Boulder High School.
Ownership History
Date
Name
Owned For
Owner Type
Purchase Details
Closed on
Jun 24, 2011
Sold by
Kenny Ciaran P and Kenny Stefanie A
Bought by
Goodson Chad Michael
Current Estimated Value
Purchase Details
Closed on
Jan 28, 2000
Sold by
John Laferlita and John Audrey
Bought by
Lavender Michael A
Home Financials for this Owner
Home Financials are based on the most recent Mortgage that was taken out on this home.
Original Mortgage
$237,500
Interest Rate
7.87%
Purchase Details
Closed on
Nov 16, 1989
Bought by
Goodson Chad Michael and Goodson Jessica Eve
Purchase Details
Closed on
Dec 23, 1983
Bought by
Goodson Chad Michael and Goodson Jessica Eve
Purchase Details
Closed on
Jul 16, 1979
Bought by
Goodson Chad Michael and Goodson Jessica Eve
Create a Home Valuation Report for This Property
The Home Valuation Report is an in-depth analysis detailing your home's value as well as a comparison with similar homes in the area
Home Values in the Area
Average Home Value in this Area
Purchase History
| Date | Buyer | Sale Price | Title Company |
|---|---|---|---|
| Goodson Chad Michael | $598,000 | Land Title Guarantee Company | |
| Lavender Michael A | $337,500 | -- | |
| Goodson Chad Michael | $132,000 | -- | |
| Goodson Chad Michael | $117,000 | -- | |
| Goodson Chad Michael | $93,800 | -- |
Source: Public Records
Mortgage History
| Date | Status | Borrower | Loan Amount |
|---|---|---|---|
| Previous Owner | Lavender Michael A | $237,500 |
Source: Public Records
Tax History
| Year | Tax Paid | Tax Assessment Tax Assessment Total Assessment is a certain percentage of the fair market value that is determined by local assessors to be the total taxable value of land and additions on the property. | Land | Improvement |
|---|---|---|---|---|
| 2025 | $8,683 | $93,307 | $56,069 | $37,238 |
| 2024 | $8,683 | $93,307 | $56,069 | $37,238 |
| 2023 | $8,533 | $98,805 | $57,962 | $44,528 |
| 2022 | $7,214 | $77,688 | $46,760 | $30,928 |
| 2021 | $6,879 | $79,923 | $48,105 | $31,818 |
| 2020 | $5,744 | $65,987 | $43,043 | $22,944 |
| 2019 | $5,656 | $65,987 | $43,043 | $22,944 |
| 2018 | $5,393 | $62,208 | $31,824 | $30,384 |
| 2017 | $5,225 | $68,774 | $35,183 | $33,591 |
| 2016 | $4,611 | $53,261 | $29,930 | $23,331 |
| 2015 | $4,366 | $46,391 | $20,935 | $25,456 |
| 2014 | $3,901 | $46,391 | $20,935 | $25,456 |
Source: Public Records
Map
Nearby Homes
- 1695 Orchard Ave
- 1801 Redwood Ave
- 1560 Sumac Ave
- 1487 Periwinkle Dr
- 1800 Sumac Ave
- 1505 Oak Ave
- 1620 Oak Ave
- 1690 Wilson Ct
- 3850 Broadway St Unit 24
- 1205 Sumac Ave
- 1110 Poplar Ave
- 1945 Norwood Ave
- 1245 Norwood Ave Unit 42
- 1180 Oakdale Place
- 1285 Meadow Place
- 1152 Orange Place
- 2158 Tamarack Ave
- 4893 Broadway
- 2116 Vine Ave
- 2126 Vine Ave
- 1665 Quince Ave
- 1695 Quince Ave
- 1688 Redwood Ave
- 1640 Redwood Ave
- 1694 Redwood Ave
- 1696 Quince Ave
- 1630 Redwood Ave
- 3995 17th St
- 1605 Quince Ave
- 1705 Quince Ave
- 1600 Redwood Ave
- 1700 Redwood Ave
- 1620 Quince Ave
- 1600 Quince Ave
- 1708 Quince Ave
- 1575 Quince Ave
- 3975 17th St
- 1735 Quince Ave
- 1580 Redwood Ave
- 1710 Redwood Ave
Your Personal Tour Guide
Ask me questions while you tour the home.