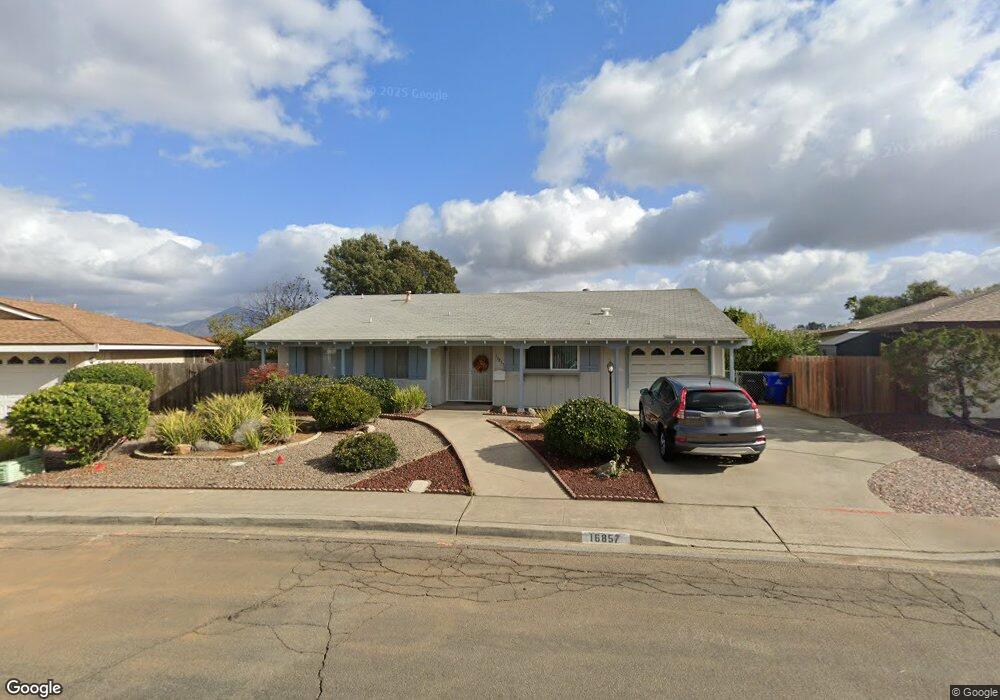
16857 Bellota Dr San Diego, CA 92128
Rancho Bernardo NeighborhoodEstimated Value: $801,418 - $1,015,000
2
Beds
2
Baths
1,197
Sq Ft
$733/Sq Ft
Est. Value
About This Home
This home is located at 16857 Bellota Dr, San Diego, CA 92128 and is currently estimated at $877,355, approximately $732 per square foot. 16857 Bellota Dr is a home located in San Diego County with nearby schools including Highland Ranch Elementary School, Bernardo Heights Middle, and Rancho Bernardo High.
Ownership History
Date
Name
Owned For
Owner Type
Purchase Details
Closed on
Sep 24, 2016
Sold by
Donovan Peter M and Donovan Kathleen A
Bought by
Donovan Peter M and Donovan Kathleen A
Current Estimated Value
Purchase Details
Closed on
May 8, 2013
Sold by
Ashbarry Michele Lee and Ashbarry Michele Lee
Bought by
Donovan Peter M and Donovan Kathleen A
Home Financials for this Owner
Home Financials are based on the most recent Mortgage that was taken out on this home.
Original Mortgage
$164,000
Outstanding Balance
$115,636
Interest Rate
3.37%
Mortgage Type
New Conventional
Estimated Equity
$761,719
Purchase Details
Closed on
Apr 6, 2005
Sold by
Ciofal Frances
Bought by
Ciofal Frances
Purchase Details
Closed on
Sep 12, 1994
Sold by
Flynn John A and Flynn Louise M
Bought by
Ciofal Frances
Home Financials for this Owner
Home Financials are based on the most recent Mortgage that was taken out on this home.
Original Mortgage
$114,700
Interest Rate
8.7%
Purchase Details
Closed on
Jul 1, 1988
Create a Home Valuation Report for This Property
The Home Valuation Report is an in-depth analysis detailing your home's value as well as a comparison with similar homes in the area
Home Values in the Area
Average Home Value in this Area
Purchase History
| Date | Buyer | Sale Price | Title Company |
|---|---|---|---|
| Donovan Peter M | -- | None Available | |
| Donovan Peter M | $364,000 | Fidelity National Title Co | |
| Ciofal Frances | -- | -- | |
| Ciofal Frances | $153,000 | Fidelity National Title | |
| -- | $117,000 | -- |
Source: Public Records
Mortgage History
| Date | Status | Borrower | Loan Amount |
|---|---|---|---|
| Open | Donovan Peter M | $164,000 | |
| Previous Owner | Ciofal Frances | $114,700 |
Source: Public Records
Tax History Compared to Growth
Tax History
| Year | Tax Paid | Tax Assessment Tax Assessment Total Assessment is a certain percentage of the fair market value that is determined by local assessors to be the total taxable value of land and additions on the property. | Land | Improvement |
|---|---|---|---|---|
| 2025 | $5,003 | $448,226 | $258,594 | $189,632 |
| 2024 | $5,003 | $439,438 | $253,524 | $185,914 |
| 2023 | $4,897 | $430,822 | $248,553 | $182,269 |
| 2022 | $4,816 | $422,376 | $243,680 | $178,696 |
| 2021 | $4,753 | $414,095 | $238,902 | $175,193 |
| 2020 | $4,690 | $409,850 | $236,453 | $173,397 |
| 2019 | $4,569 | $401,815 | $231,817 | $169,998 |
| 2018 | $4,441 | $393,937 | $227,272 | $166,665 |
| 2017 | $4,323 | $386,214 | $222,816 | $163,398 |
| 2016 | $4,234 | $378,643 | $218,448 | $160,195 |
| 2015 | $4,172 | $372,956 | $215,167 | $157,789 |
| 2014 | $4,074 | $365,652 | $210,953 | $154,699 |
Source: Public Records
Map
Nearby Homes
- 16856 Bellota Dr
- 16881 Bellota Dr
- 16866 Acebo Dr
- 16846 Dominican Dr Unit 4
- 16859 Acebo Dr
- 16924 Bellota Dr
- 16710 Obispo Ln
- 16799 Acena Dr
- 12215 Santiago Rd W Unit Santiago
- 11941 Callado Rd
- 16731 Acena Dr
- 12085 Calle de Maria
- 12093 Callado Rd
- 12195 San Tomas Place
- 12093 Caminito Campana
- 12094 Caminito Campana
- 16660 Roca Dr
- 12215 Rios Rd
- 11984 Rancho Bernardo Rd Unit J
- 16632 Roca Dr Unit 41
- 16851 Bellota Dr
- 16863 Bellota Dr
- 12161 Bellota Place
- 12106 Obispo Rd
- 12112 Obispo Rd
- 16845 Bellota Dr
- 12088 Obispo Rd
- 16866 Bellota Dr
- 12171 Bellota Place
- 16850 Bellota Dr
- 12150 Bellota Place
- 12078 Obispo Rd Unit 4
- 16839 Bellota Dr
- 16872 Bellota Dr
- 12124 Obispo Rd Unit 4
- 12170 Bellota Place
- 16825 Dominican Dr
- 12068 Obispo Rd
- 12160 Bellota Place
- 16839 Dominican Dr