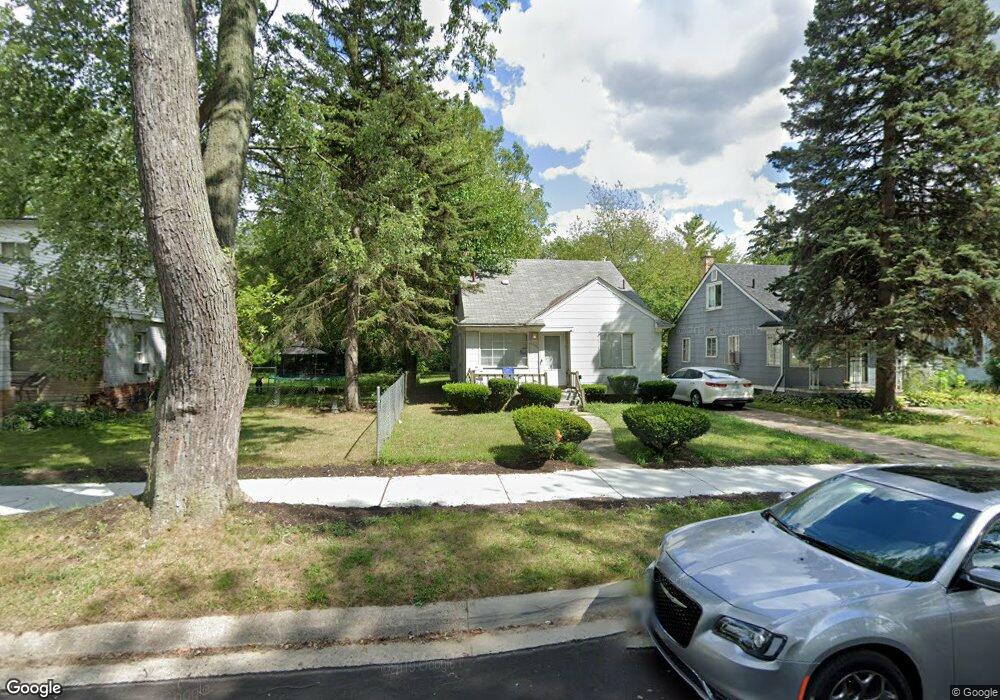
16866 Fenton St Detroit, MI 48219
Estimated Value: $68,134 - $101,000
3
Beds
1
Bath
813
Sq Ft
$101/Sq Ft
Est. Value
About This Home
This home is located at 16866 Fenton St, Detroit, MI 48219 and is currently estimated at $82,034, approximately $100 per square foot. 16866 Fenton St is a home located in Wayne County with nearby schools including Ralph W. Emerson Elementary-Middle School, Charles L. Spain Elementary-Middle School, and Edward 'Duke' Ellington Conservatory of Music and Art.
Ownership History
Date
Name
Owned For
Owner Type
Purchase Details
Closed on
Aug 23, 2022
Sold by
Spencer Onitra K
Bought by
Chattam Dwayne Bryant
Current Estimated Value
Purchase Details
Closed on
Apr 24, 2021
Sold by
Hurst Dawnesha R
Bought by
Spencer Onitra K
Purchase Details
Closed on
Mar 23, 2016
Sold by
Hurst Dawnesha R
Bought by
Spencer Onitra K
Purchase Details
Closed on
Feb 19, 2013
Sold by
Barnum Patricia
Bought by
Hurst Dawnesha R
Purchase Details
Closed on
Oct 30, 2007
Sold by
Fannie Mae
Bought by
Barnum Pat
Purchase Details
Closed on
May 18, 2006
Sold by
Countrywide Home Loans Inc
Bought by
Federal National Mortgage Association
Purchase Details
Closed on
May 17, 2006
Sold by
Mccoy Toni and Mccoy Toni L
Bought by
Countrywide Home Loans Inc
Purchase Details
Closed on
Aug 27, 1999
Sold by
Coolman Judith A
Bought by
Mccoy Toni L
Create a Home Valuation Report for This Property
The Home Valuation Report is an in-depth analysis detailing your home's value as well as a comparison with similar homes in the area
Home Values in the Area
Average Home Value in this Area
Purchase History
| Date | Buyer | Sale Price | Title Company |
|---|---|---|---|
| Chattam Dwayne Bryant | -- | -- | |
| Spencer Onitra K | $10,000 | None Available | |
| Spencer Onitra K | -- | None Available | |
| Hurst Dawnesha R | -- | None Available | |
| Barnum Pat | $4,500 | Greco | |
| Federal National Mortgage Association | -- | None Available | |
| Countrywide Home Loans Inc | $69,038 | None Available | |
| Mccoy Toni L | $73,500 | -- |
Source: Public Records
Tax History Compared to Growth
Tax History
| Year | Tax Paid | Tax Assessment Tax Assessment Total Assessment is a certain percentage of the fair market value that is determined by local assessors to be the total taxable value of land and additions on the property. | Land | Improvement |
|---|---|---|---|---|
| 2025 | $1,357 | $27,300 | $0 | $0 |
| 2024 | $1,357 | $23,000 | $0 | $0 |
| 2023 | $1,316 | $18,000 | $0 | $0 |
| 2022 | $963 | $15,400 | $0 | $0 |
| 2021 | $947 | $12,900 | $0 | $0 |
| 2020 | $802 | $11,100 | $0 | $0 |
| 2019 | $791 | $8,700 | $0 | $0 |
| 2018 | $690 | $8,100 | $0 | $0 |
| 2017 | $142 | $7,500 | $0 | $0 |
| 2016 | $1,203 | $16,000 | $0 | $0 |
| 2015 | $1,600 | $16,000 | $0 | $0 |
| 2013 | $2,254 | $22,541 | $0 | $0 |
| 2010 | -- | $32,297 | $1,000 | $31,297 |
Source: Public Records
Map
Nearby Homes
- 24451 W McNichols Rd
- 16599 Lenore
- 16580 Winston St
- 16618 Salem St
- 16520 Lenore
- 17167 Salem St
- 16865 Five Points St
- 16580 Five Points St
- 17334 Winston St
- 17175 Five Points St
- 16131 Lenore
- 16183 Salem St
- 17343 Salem St
- 16124 Wormer St
- 15869 Wormer
- 17465 Fenton St
- 17317 Brady
- 24478 Pilgrim
- 17648 Wormer St
- 17664 Winston St
- 16856 Fenton St
- 16878 Fenton St
- 16846 Fenton St
- 16886 Fenton St
- 16840 Fenton St
- 16894 Fenton St
- 16863 Lenore
- 16875 Lenore
- 16830 Fenton St
- 16843 Lenore
- 16900 Fenton St
- 16895 Lenore
- 16863 Fenton St
- 16873 Fenton St
- 16820 Fenton St
- 16851 Fenton St
- 16881 Fenton St
- 16835 Lenore
- 16843 Fenton St
- 16907 Lenore