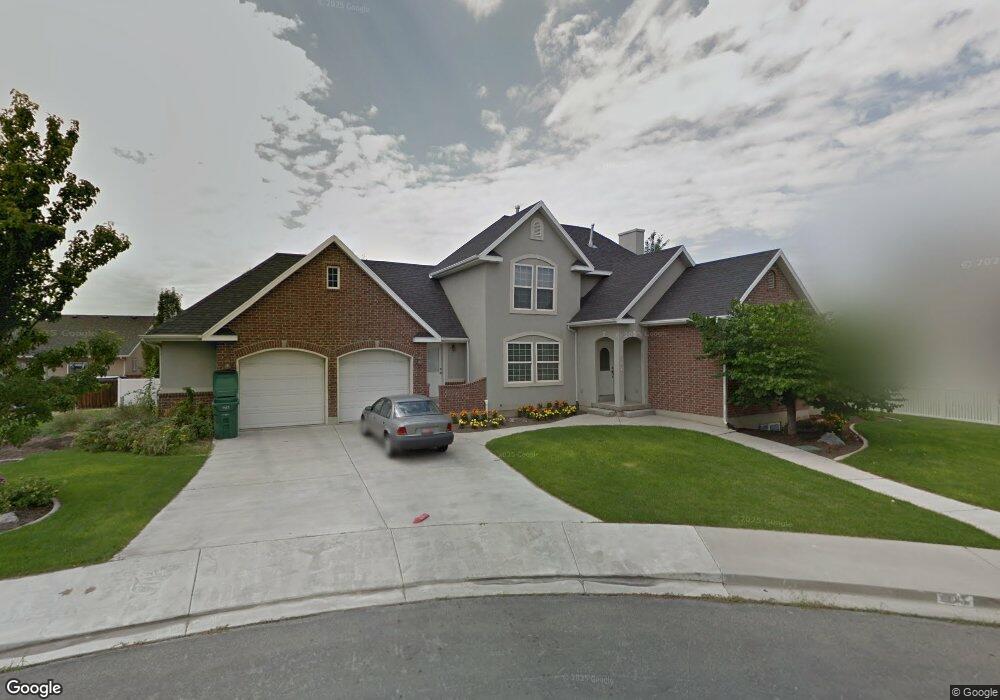
1687 N 2050 W Provo, UT 84604
Grandview North NeighborhoodEstimated Value: $610,000 - $932,000
3
Beds
3
Baths
2,386
Sq Ft
$328/Sq Ft
Est. Value
About This Home
This home is located at 1687 N 2050 W, Provo, UT 84604 and is currently estimated at $782,146, approximately $327 per square foot. 1687 N 2050 W is a home located in Utah County with nearby schools including Westridge Elementary School, Dixon Middle School, and Provo High School.
Ownership History
Date
Name
Owned For
Owner Type
Purchase Details
Closed on
Aug 15, 2025
Sold by
Lindsay Sheldon B and Lindsay Pamela A
Bought by
Porter Brock
Current Estimated Value
Purchase Details
Closed on
Oct 3, 1998
Sold by
G & L Investment Company
Bought by
Lindsay Sheldon B and Lindsay Pamela A
Create a Home Valuation Report for This Property
The Home Valuation Report is an in-depth analysis detailing your home's value as well as a comparison with similar homes in the area
Home Values in the Area
Average Home Value in this Area
Purchase History
| Date | Buyer | Sale Price | Title Company |
|---|---|---|---|
| Porter Brock | -- | Trident Title | |
| Lindsay Sheldon B | -- | -- |
Source: Public Records
Tax History Compared to Growth
Tax History
| Year | Tax Paid | Tax Assessment Tax Assessment Total Assessment is a certain percentage of the fair market value that is determined by local assessors to be the total taxable value of land and additions on the property. | Land | Improvement |
|---|---|---|---|---|
| 2025 | $3,744 | $399,630 | $290,500 | $436,100 |
| 2024 | $3,744 | $368,500 | $0 | $0 |
| 2023 | $3,810 | $369,765 | $0 | $0 |
| 2022 | $3,911 | $382,690 | $0 | $0 |
| 2021 | $3,254 | $555,400 | $226,900 | $328,500 |
| 2020 | $3,189 | $510,200 | $197,300 | $312,900 |
| 2019 | $3,039 | $505,700 | $197,300 | $308,400 |
| 2018 | $2,646 | $446,500 | $178,300 | $268,200 |
| 2017 | $2,373 | $220,055 | $0 | $0 |
| 2016 | $2,522 | $217,965 | $0 | $0 |
| 2015 | $2,481 | $216,700 | $0 | $0 |
| 2014 | $2,325 | $211,695 | $0 | $0 |
Source: Public Records
Map
Nearby Homes