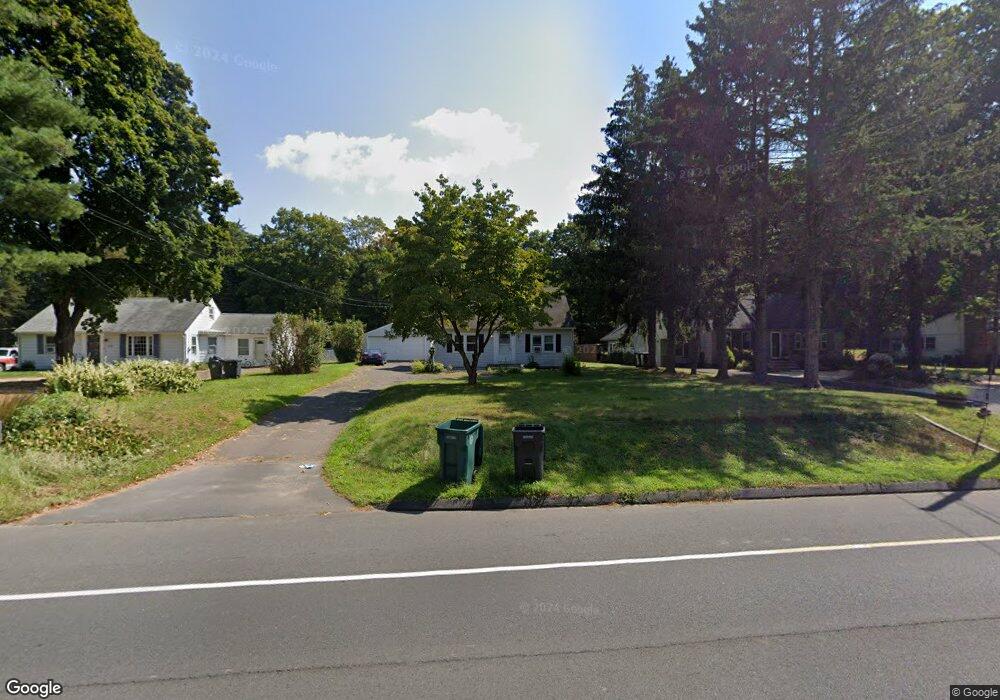
1688 S Main St Cheshire, CT 06410
Estimated Value: $346,000 - $480,000
2
Beds
2
Baths
1,480
Sq Ft
$267/Sq Ft
Est. Value
About This Home
This home is located at 1688 S Main St, Cheshire, CT 06410 and is currently estimated at $395,373, approximately $267 per square foot. 1688 S Main St is a home located in New Haven County with nearby schools including Darcey School, Norton School, and Dodd Middle School.
Ownership History
Date
Name
Owned For
Owner Type
Purchase Details
Closed on
Jun 11, 2021
Sold by
Boyd Camille D
Bought by
Henninger Gina M and Bastidas-Silva Jose
Current Estimated Value
Home Financials for this Owner
Home Financials are based on the most recent Mortgage that was taken out on this home.
Original Mortgage
$251,201
Outstanding Balance
$227,431
Interest Rate
2.9%
Mortgage Type
FHA
Estimated Equity
$167,942
Purchase Details
Closed on
Oct 31, 2002
Sold by
Jamele David M and Jamele Linda M
Bought by
Harris Camille D
Home Financials for this Owner
Home Financials are based on the most recent Mortgage that was taken out on this home.
Original Mortgage
$147,500
Interest Rate
6.09%
Purchase Details
Closed on
Feb 11, 1992
Sold by
Mangini Mary
Bought by
Pagano Linda and Jamele David
Purchase Details
Closed on
Jul 1, 1987
Sold by
Christina Joseph
Bought by
Mangini Mary Grace
Create a Home Valuation Report for This Property
The Home Valuation Report is an in-depth analysis detailing your home's value as well as a comparison with similar homes in the area
Home Values in the Area
Average Home Value in this Area
Purchase History
| Date | Buyer | Sale Price | Title Company |
|---|---|---|---|
| Henninger Gina M | $235,000 | None Available | |
| Henninger Gina M | $235,000 | None Available | |
| Harris Camille D | $191,500 | -- | |
| Harris Camille D | $191,500 | -- | |
| Pagano Linda | $126,000 | -- | |
| Mangini Mary Grace | $158,000 | -- |
Source: Public Records
Mortgage History
| Date | Status | Borrower | Loan Amount |
|---|---|---|---|
| Open | Henninger Gina M | $251,201 | |
| Closed | Henninger Gina M | $251,201 | |
| Previous Owner | Mangini Mary Grace | $74,000 | |
| Previous Owner | Mangini Mary Grace | $147,500 |
Source: Public Records
Tax History Compared to Growth
Tax History
| Year | Tax Paid | Tax Assessment Tax Assessment Total Assessment is a certain percentage of the fair market value that is determined by local assessors to be the total taxable value of land and additions on the property. | Land | Improvement |
|---|---|---|---|---|
| 2025 | $5,810 | $195,370 | $63,700 | $131,670 |
| 2024 | $5,365 | $195,370 | $63,700 | $131,670 |
| 2023 | $4,989 | $142,170 | $63,690 | $78,480 |
| 2022 | $4,879 | $142,170 | $63,690 | $78,480 |
| 2021 | $4,794 | $142,170 | $63,690 | $78,480 |
| 2020 | $4,723 | $142,170 | $63,690 | $78,480 |
| 2019 | $4,723 | $142,170 | $63,690 | $78,480 |
| 2018 | $4,562 | $139,840 | $61,690 | $78,150 |
| 2017 | $4,466 | $139,840 | $61,690 | $78,150 |
| 2016 | $4,292 | $139,840 | $61,690 | $78,150 |
| 2015 | $4,292 | $139,840 | $61,690 | $78,150 |
| 2014 | $4,230 | $139,840 | $61,690 | $78,150 |
Source: Public Records
Map
Nearby Homes
- 1600RR S Main St
- 1600 S Main St
- 1600 S Main St Unit BFraser Model
- 1600 S Main St Unit Model A (Charter Oak
- 25 Hidden Place
- 0 Old Lane Rd
- 118 Harrison Rd
- Lot 2 Mount Sanford Rd
- Lot 1 Mount Sanford Rd
- 31 Bruschayt Dr
- Lot 3 Mount Sanford Rd
- 115 S Brooksvale Rd
- 164 S Brooksvale Rd
- 40 Southwick Ct Unit 201
- 40 Southwick Ct Unit 106
- 1364 Avon Blvd
- 23 Jo Marg Dr
- 353 Mount Sanford Rd
- 1325 Avon Blvd
- 1213 Avon Blvd
- 1700 S Main St
- 1678 S Main St
- 1668 S Main St
- 1706 S Main St
- 1707 Orchard Hill Rd
- 1695 Orchard Hill Rd
- 7 Fenn Rd
- 1717 Orchard Hill Rd
- 1720 S Main St
- 17 Fenn Rd
- 1725 Orchard Hill Rd
- 1693 S Main St
- 1671 Orchard Hill Rd
- 23 Fenn Rd
- 1683 S Main St
- 29 Fenn Rd
- 1721 S Main St
- 1667 S Main St
- 1661 Orchard Hill Rd
- 1732 S Main St