Estimated Value: $792,000 - $881,000
4
Beds
3
Baths
2,443
Sq Ft
$336/Sq Ft
Est. Value
About This Home
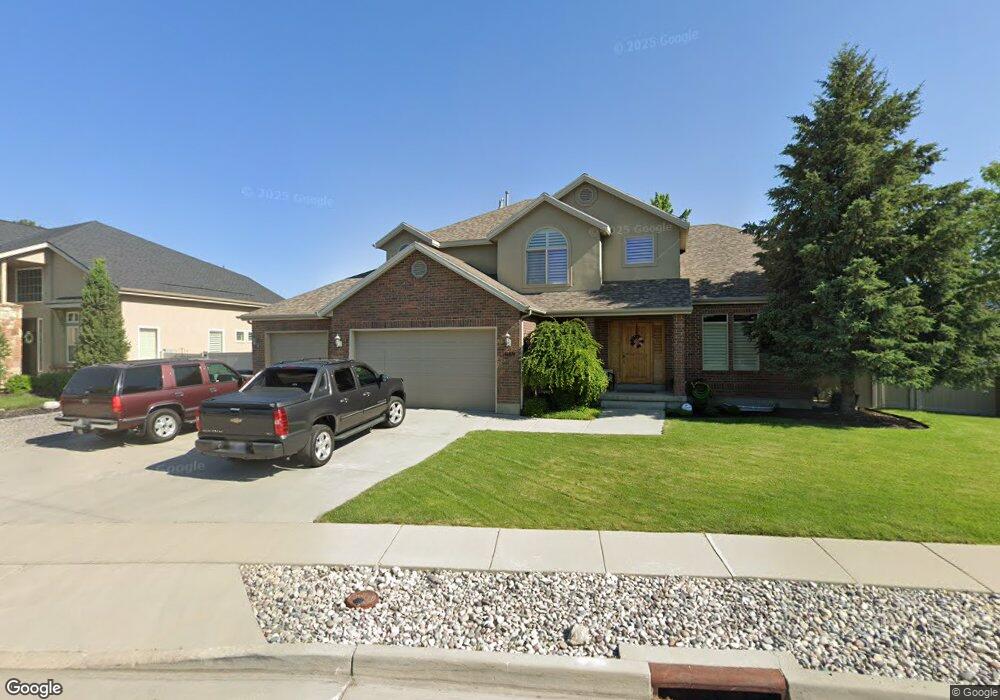
This home is located at 1689 Crescent View Cir, Sandy, UT 84092 and is currently estimated at $820,827, approximately $335 per square foot. 1689 Crescent View Cir is a home located in Salt Lake County with nearby schools including Sunrise Elementary School, Bell Canyon Montessori School, and Challenger School - Sandy.
Ownership History
Date
Name
Owned For
Owner Type
Purchase Details
Closed on
Jun 18, 2024
Sold by
Richard C Lemay Trust and Lemay Richard C
Bought by
Clarke Robert J and Clarke Virginia D
Current Estimated Value
Purchase Details
Closed on
Mar 24, 2014
Sold by
Lemay Richard C
Bought by
Lemay Richard C and The Richard C Lemay Trust
Purchase Details
Closed on
Mar 31, 2011
Sold by
Eldredge Travis C and Eldredge Jessica B
Bought by
Lemay Richard C
Purchase Details
Closed on
Mar 3, 2004
Sold by
Neff A Robert
Bought by
Eldredge Travis C and Eldredge Jessica B
Home Financials for this Owner
Home Financials are based on the most recent Mortgage that was taken out on this home.
Original Mortgage
$240,000
Interest Rate
4.75%
Mortgage Type
Purchase Money Mortgage
Purchase Details
Closed on
Aug 30, 2000
Sold by
Sunrise Capital Llc
Bought by
Neff Robert
Create a Home Valuation Report for This Property
The Home Valuation Report is an in-depth analysis detailing your home's value as well as a comparison with similar homes in the area
Home Values in the Area
Average Home Value in this Area
Purchase History
| Date | Buyer | Sale Price | Title Company |
|---|---|---|---|
| Clarke Robert J | -- | Cottonwood Title | |
| Lemay Richard C | -- | None Available | |
| Lemay Richard C | -- | First American Title | |
| Eldredge Travis C | -- | Backman Stewart Title Svcs | |
| Neff Robert | -- | Backman Stewart Title Servic |
Source: Public Records
Mortgage History
| Date | Status | Borrower | Loan Amount |
|---|---|---|---|
| Previous Owner | Eldredge Travis C | $240,000 | |
| Closed | Eldredge Travis C | $60,000 |
Source: Public Records
Tax History
| Year | Tax Paid | Tax Assessment Tax Assessment Total Assessment is a certain percentage of the fair market value that is determined by local assessors to be the total taxable value of land and additions on the property. | Land | Improvement |
|---|---|---|---|---|
| 2025 | $3,893 | $726,100 | $278,100 | $448,000 |
| 2024 | $3,893 | $719,900 | $267,700 | $452,200 |
| 2023 | $3,544 | $653,500 | $257,400 | $396,100 |
| 2022 | $0 | $688,000 | $252,400 | $435,600 |
| 2021 | $3,458 | $530,300 | $226,900 | $303,400 |
| 2020 | $3,325 | $480,800 | $226,900 | $253,900 |
| 2019 | $3,348 | $471,800 | $214,000 | $257,800 |
Source: Public Records
Map
Nearby Homes
- 1653 Crescent View Dr
- 11341 S Silver Buckle Way
- 11318 Canyon Falls Ln
- 11382 S Canyon Falls Ln
- 11343 Clifford Cir
- 1320 E Woodhill Cir
- 10868 Prescott Dr
- 1234 E Sandy Ridge Dr
- 11129 S 2125 E
- 2026 E 10765 S
- 11755 S Canberra Dr
- 7 Rollingwood Ln
- 1129 E Sanders Rd
- 2234 E Willow Brook Way
- 2192 E High Mesa Dr
- 10889 Granite Dr
- 2250 High Mountain Dr
- 11855 S Hidden Valley Dr
- 2232 E Lone Eagle Ln
- 1074 E Black Forest Dr
- 1689 E Crescent View Cir
- 1690 E 11245 S
- 1677 Crescent View Dr
- 1677 E Crescent View Cir
- 1677 Crescent View Cir
- 1688 E 11245 S
- 1676 E 11245 S
- 1665 Crescent View Cir
- 1690 E Crescent View Cir
- 1690 Crescent View Cir
- 1690 Crescent View Cir Unit 1
- 1721 Crescent View Dr
- 1664 E 11245 S
- 1678 Crescent View Dr
- 1678 Crescent View Cir
- 1678 Crescent View Cir Unit 2
- 1678 E Crescent View Cir
- 1720 Crescent View Dr
- 11257 S 1700 E
- 1653 Crescent View Cir
Your Personal Tour Guide
Ask me questions while you tour the home.