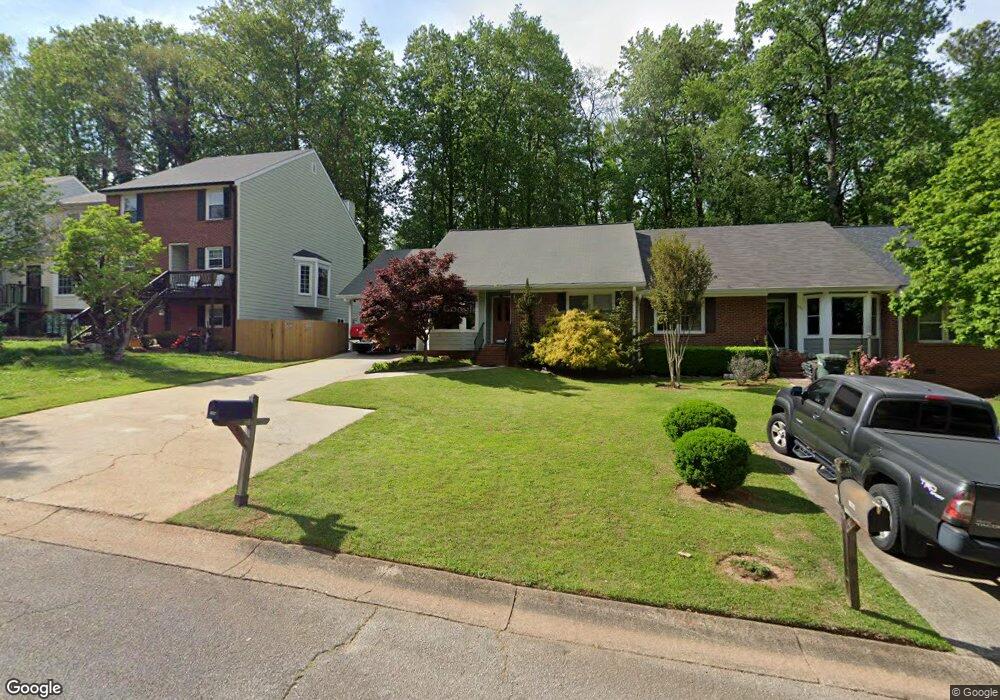
169 Brighton Ct SW Unit 3 Marietta, GA 30064
Southwestern Marietta NeighborhoodEstimated Value: $247,000 - $263,000
2
Beds
2
Baths
1,198
Sq Ft
$211/Sq Ft
Est. Value
About This Home
This home is located at 169 Brighton Ct SW Unit 3, Marietta, GA 30064 and is currently estimated at $252,468, approximately $210 per square foot. 169 Brighton Ct SW Unit 3 is a home located in Cobb County with nearby schools including A.L. Burruss Elementary School, Marietta Sixth Grade Academy, and Marietta Middle School.
Ownership History
Date
Name
Owned For
Owner Type
Purchase Details
Closed on
Jan 22, 2018
Sold by
Michael Osborne B
Bought by
Findley Cleo E and Osborne Michael
Current Estimated Value
Purchase Details
Closed on
May 12, 2016
Sold by
Findley Cleo E
Bought by
Osborne B Michael
Purchase Details
Closed on
Oct 14, 2011
Sold by
Findley Cleo E
Bought by
Findley Cleo E and Findley Michael Osborne
Purchase Details
Closed on
Aug 13, 1999
Sold by
Hall Virginia D
Bought by
Findley Cleo E
Home Financials for this Owner
Home Financials are based on the most recent Mortgage that was taken out on this home.
Original Mortgage
$60,000
Interest Rate
7.65%
Mortgage Type
New Conventional
Create a Home Valuation Report for This Property
The Home Valuation Report is an in-depth analysis detailing your home's value as well as a comparison with similar homes in the area
Home Values in the Area
Average Home Value in this Area
Purchase History
| Date | Buyer | Sale Price | Title Company |
|---|---|---|---|
| Findley Cleo E | -- | -- | |
| Osborne B Michael | $110,000 | -- | |
| Findley Cleo E | -- | -- | |
| Findley Cleo E | $90,000 | -- |
Source: Public Records
Mortgage History
| Date | Status | Borrower | Loan Amount |
|---|---|---|---|
| Previous Owner | Findley Cleo E | $60,000 |
Source: Public Records
Tax History Compared to Growth
Tax History
| Year | Tax Paid | Tax Assessment Tax Assessment Total Assessment is a certain percentage of the fair market value that is determined by local assessors to be the total taxable value of land and additions on the property. | Land | Improvement |
|---|---|---|---|---|
| 2025 | $105 | $88,732 | $28,000 | $60,732 |
| 2024 | $105 | $88,732 | $28,000 | $60,732 |
| 2023 | $0 | $88,732 | $28,000 | $60,732 |
| 2022 | $105 | $67,476 | $21,600 | $45,876 |
| 2021 | $113 | $66,848 | $21,600 | $45,248 |
| 2020 | $112 | $57,004 | $19,200 | $37,804 |
| 2019 | $111 | $48,072 | $16,000 | $32,072 |
| 2018 | $110 | $43,512 | $8,000 | $35,512 |
| 2017 | $89 | $43,512 | $8,000 | $35,512 |
| 2016 | $92 | $43,512 | $8,000 | $35,512 |
| 2015 | $100 | $37,072 | $9,720 | $27,352 |
| 2014 | $103 | $37,072 | $0 | $0 |
Source: Public Records
Map
Nearby Homes
- 1141 Whitlock Ave NW
- 594 Manning Rd SW
- 805 Manning Way SW
- 818 Manning Way SW Unit 1
- 1077 New Haven Dr SW Unit 12A
- 560 Manning Rd SW
- 945 Burnt Hickory Cir NW Unit 8
- 927 Burnt Hickory Cir NW Unit 10
- 1032 Chippendale Trail SW
- 260 Manning Rd SW Unit 110
- 332 Rockmann Ln SW
- 1161 Rockmann Terrace SW
- 1211 Cliffpine Ct SW
- 917 Wemberley Ln
- 909 Wemberley Ln
- 984 Wemberley Ln
- 839 Manning Villas Ct SW
- 171 Brighton Ct SW
- 165 Brighton Ct SW
- 165 Brighton Ct SW
- 173 Brighton Ct SW Unit 3
- 161 Brighton Ct SW
- 163 Brighton Ct SW
- 161 Brighton Ct SW Unit 161
- 175 Brighton Ct SW Unit 175
- 175 Brighton Ct SW
- 177 Brighton Ct SW
- 159 Brighton Ct SW
- 159 Brighton Ct SW Unit 159
- 179 Brighton Ct SW
- 164 Brighton Ct SW
- 158 Brighton Ct SW
- 162 Brighton Ct SW
- 160 Brighton Ct SW
- 166 Brighton Ct SW Unit 3
- 156 Brighton Ct SW
- 157 Brighton Ct SW Unit 3