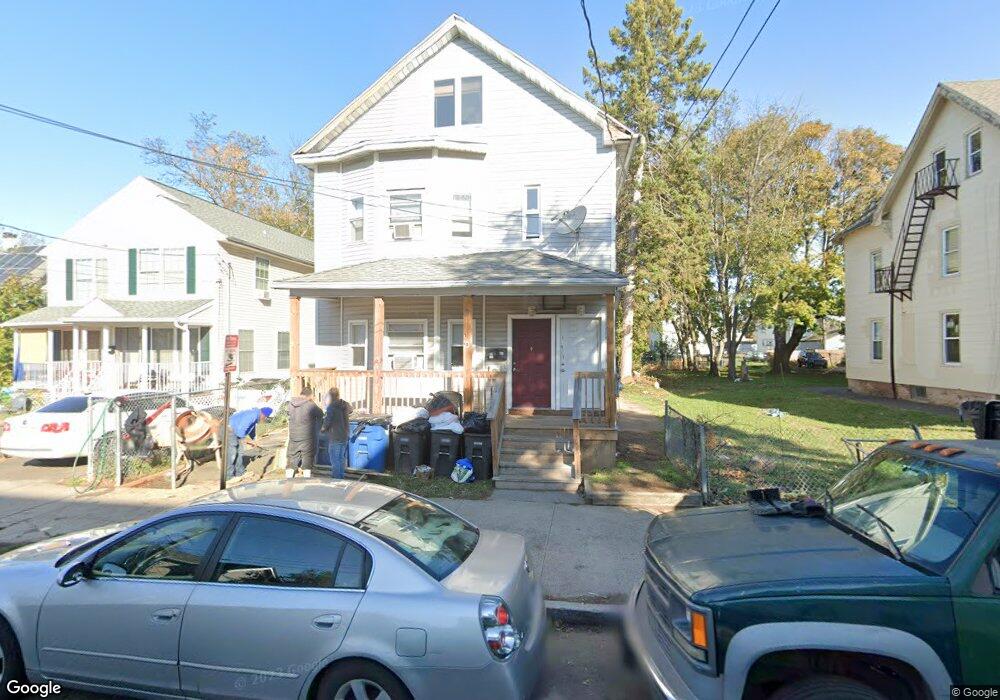
169 Clay St New Haven, CT 06513
Fair Haven NeighborhoodEstimated Value: $368,596 - $459,000
5
Beds
3
Baths
2,512
Sq Ft
$158/Sq Ft
Est. Value
About This Home
This home is located at 169 Clay St, New Haven, CT 06513 and is currently estimated at $396,899, approximately $158 per square foot. 169 Clay St is a home located in New Haven County with nearby schools including Elm City College Preparatory School, Cold Spring School, and St Francis & St Rose Of Lima School.
Ownership History
Date
Name
Owned For
Owner Type
Purchase Details
Closed on
Feb 20, 2013
Sold by
Intravia Paul and Capuano Frank
Bought by
Cclay St Llc
Current Estimated Value
Home Financials for this Owner
Home Financials are based on the most recent Mortgage that was taken out on this home.
Original Mortgage
$116,000
Interest Rate
3.57%
Mortgage Type
Stand Alone Refi Refinance Of Original Loan
Purchase Details
Closed on
Dec 12, 2012
Sold by
Popolizo John and Popolizo Judith
Bought by
Intravia Paul and Capuano Frank
Purchase Details
Closed on
Mar 15, 2005
Sold by
Boyanowski Andrew
Bought by
Popolizio Judith and Popolizio John
Home Financials for this Owner
Home Financials are based on the most recent Mortgage that was taken out on this home.
Original Mortgage
$164,800
Interest Rate
5.64%
Purchase Details
Closed on
Apr 16, 1997
Sold by
Fnma
Bought by
Rodriquez Isabel
Create a Home Valuation Report for This Property
The Home Valuation Report is an in-depth analysis detailing your home's value as well as a comparison with similar homes in the area
Home Values in the Area
Average Home Value in this Area
Purchase History
| Date | Buyer | Sale Price | Title Company |
|---|---|---|---|
| Cclay St Llc | -- | -- | |
| Intravia Paul | $76,000 | -- | |
| Popolizio John | -- | -- | |
| Popolizio Judith | $206,000 | -- | |
| Rodriquez Isabel | $4,000 | -- |
Source: Public Records
Mortgage History
| Date | Status | Borrower | Loan Amount |
|---|---|---|---|
| Open | Rodriquez Isabel | $105,000 | |
| Closed | Rodriquez Isabel | $116,000 | |
| Previous Owner | Rodriquez Isabel | $164,800 |
Source: Public Records
Tax History Compared to Growth
Tax History
| Year | Tax Paid | Tax Assessment Tax Assessment Total Assessment is a certain percentage of the fair market value that is determined by local assessors to be the total taxable value of land and additions on the property. | Land | Improvement |
|---|---|---|---|---|
| 2025 | $6,790 | $172,340 | $27,230 | $145,110 |
| 2024 | $6,635 | $172,340 | $27,230 | $145,110 |
| 2023 | $6,411 | $172,340 | $27,230 | $145,110 |
| 2022 | $6,851 | $172,340 | $27,230 | $145,110 |
| 2021 | $4,368 | $99,540 | $21,770 | $77,770 |
| 2020 | $4,368 | $99,540 | $21,770 | $77,770 |
| 2019 | $4,278 | $99,540 | $21,770 | $77,770 |
| 2018 | $4,278 | $99,540 | $21,770 | $77,770 |
| 2017 | $3,850 | $99,540 | $21,770 | $77,770 |
| 2016 | $3,196 | $76,930 | $14,490 | $62,440 |
| 2015 | $3,196 | $76,930 | $14,490 | $62,440 |
| 2014 | $3,196 | $76,930 | $14,490 | $62,440 |
Source: Public Records
Map
Nearby Homes