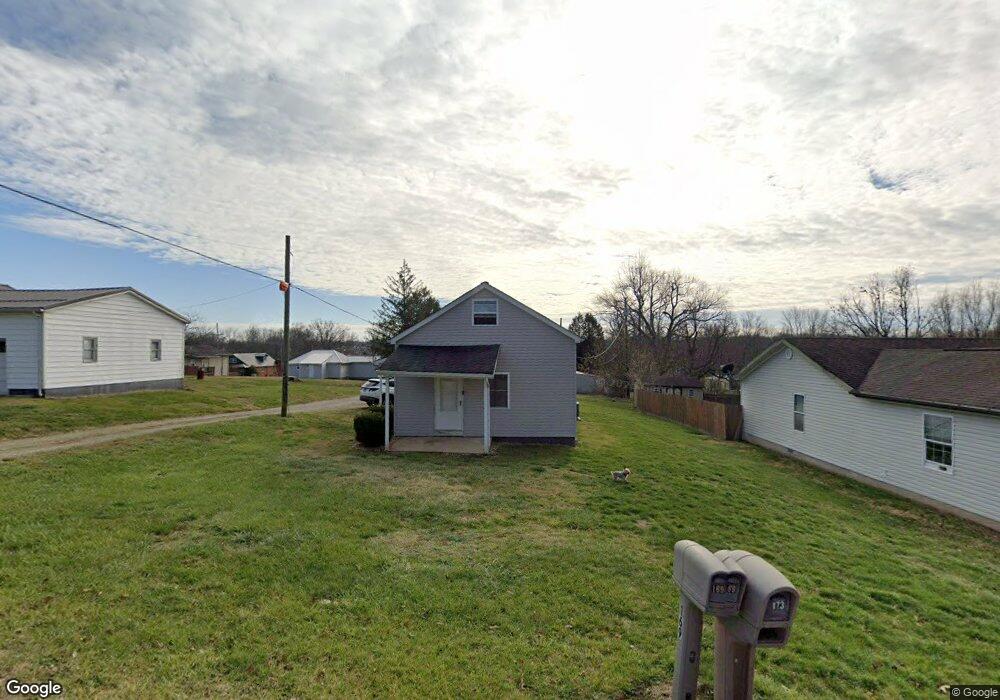
169 Coffman St Jackson, OH 45640
Estimated Value: $103,000 - $129,000
3
Beds
1
Bath
840
Sq Ft
$132/Sq Ft
Est. Value
About This Home
This home is located at 169 Coffman St, Jackson, OH 45640 and is currently estimated at $110,818, approximately $131 per square foot. 169 Coffman St is a home located in Jackson County with nearby schools including Jackson High School and Christian Life Academy.
Ownership History
Date
Name
Owned For
Owner Type
Purchase Details
Closed on
Nov 16, 2015
Sold by
Wallace Michael A and Wallace Amanda J
Bought by
Ohio Power Co
Current Estimated Value
Purchase Details
Closed on
Jun 29, 2005
Sold by
Fannin Donald Gregory and Fannin Donald R
Bought by
Sexton Paul and Sexton Wendy S
Home Financials for this Owner
Home Financials are based on the most recent Mortgage that was taken out on this home.
Original Mortgage
$73,000
Interest Rate
5.75%
Mortgage Type
New Conventional
Purchase Details
Closed on
Jan 30, 2002
Sold by
Helm Mary
Bought by
Sexton Paul and Sexton Wendy S
Create a Home Valuation Report for This Property
The Home Valuation Report is an in-depth analysis detailing your home's value as well as a comparison with similar homes in the area
Home Values in the Area
Average Home Value in this Area
Purchase History
| Date | Buyer | Sale Price | Title Company |
|---|---|---|---|
| Ohio Power Co | $20,000 | Stewart Title Agency | |
| Sexton Paul | $40,000 | None Available | |
| Sexton Paul | $15,000 | -- |
Source: Public Records
Mortgage History
| Date | Status | Borrower | Loan Amount |
|---|---|---|---|
| Previous Owner | Sexton Paul | $73,000 |
Source: Public Records
Tax History
| Year | Tax Paid | Tax Assessment Tax Assessment Total Assessment is a certain percentage of the fair market value that is determined by local assessors to be the total taxable value of land and additions on the property. | Land | Improvement |
|---|---|---|---|---|
| 2024 | $567 | $15,280 | $1,950 | $13,330 |
| 2023 | $1,522 | $15,280 | $1,950 | $13,330 |
| 2022 | $685 | $13,440 | $1,830 | $11,610 |
| 2021 | $547 | $13,440 | $1,830 | $11,610 |
| 2020 | $542 | $13,440 | $1,830 | $11,610 |
| 2019 | $491 | $11,890 | $1,620 | $10,270 |
| 2018 | $473 | $11,890 | $1,620 | $10,270 |
| 2017 | $453 | $11,890 | $1,620 | $10,270 |
| 2016 | $455 | $11,790 | $1,090 | $10,700 |
| 2015 | $458 | $11,790 | $1,090 | $10,700 |
| 2013 | $438 | $11,290 | $1,090 | $10,200 |
| 2012 | $444 | $11,290 | $1,090 | $10,200 |
Source: Public Records
Map
Nearby Homes
Your Personal Tour Guide
Ask me questions while you tour the home.