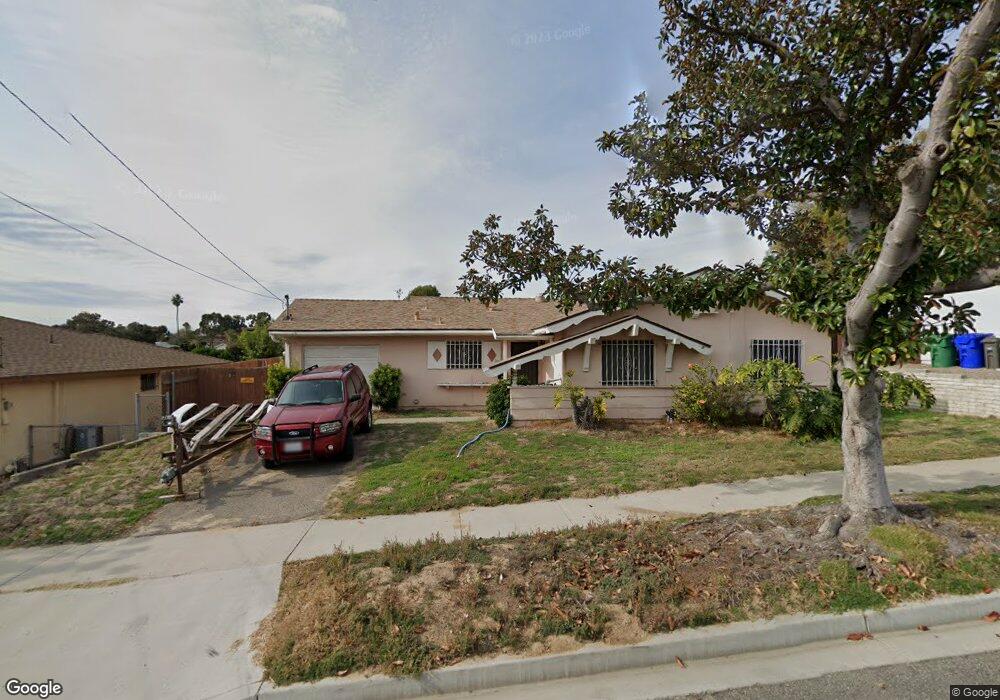
169 Cregar St Oceanside, CA 92054
Loma Alta NeighborhoodEstimated Value: $840,000 - $901,000
3
Beds
2
Baths
1,176
Sq Ft
$743/Sq Ft
Est. Value
About This Home
This home is located at 169 Cregar St, Oceanside, CA 92054 and is currently estimated at $873,982, approximately $743 per square foot. 169 Cregar St is a home located in San Diego County with nearby schools including Mission Elementary School, Oceanside High School, and Scholarship Prep Oceanside.
Ownership History
Date
Name
Owned For
Owner Type
Purchase Details
Closed on
Oct 11, 2005
Sold by
Zachwieja Joseph
Bought by
Zachwieja Joseph
Current Estimated Value
Purchase Details
Closed on
Oct 20, 2003
Sold by
Brogan Mary
Bought by
Zachwieja Joseph
Home Financials for this Owner
Home Financials are based on the most recent Mortgage that was taken out on this home.
Original Mortgage
$285,600
Interest Rate
4.25%
Mortgage Type
Purchase Money Mortgage
Purchase Details
Closed on
Jan 17, 2000
Sold by
Thomasson Jeannette E
Bought by
Thomasson Jeannette Ellen
Home Financials for this Owner
Home Financials are based on the most recent Mortgage that was taken out on this home.
Original Mortgage
$164,800
Interest Rate
7.87%
Purchase Details
Closed on
Dec 28, 1999
Sold by
Thomasson Gary
Bought by
Brogan Mary
Home Financials for this Owner
Home Financials are based on the most recent Mortgage that was taken out on this home.
Original Mortgage
$164,800
Interest Rate
7.87%
Create a Home Valuation Report for This Property
The Home Valuation Report is an in-depth analysis detailing your home's value as well as a comparison with similar homes in the area
Home Values in the Area
Average Home Value in this Area
Purchase History
| Date | Buyer | Sale Price | Title Company |
|---|---|---|---|
| Zachwieja Joseph | -- | -- | |
| Zachwieja Joseph | $357,000 | Diversified Title & Escrow S | |
| Thomasson Jeannette Ellen | -- | -- | |
| Brogan Mary | $173,500 | New Century Title Company |
Source: Public Records
Mortgage History
| Date | Status | Borrower | Loan Amount |
|---|---|---|---|
| Previous Owner | Zachwieja Joseph | $285,600 | |
| Previous Owner | Brogan Mary | $164,800 |
Source: Public Records
Tax History
| Year | Tax Paid | Tax Assessment Tax Assessment Total Assessment is a certain percentage of the fair market value that is determined by local assessors to be the total taxable value of land and additions on the property. | Land | Improvement |
|---|---|---|---|---|
| 2025 | $5,537 | $507,552 | $355,431 | $152,121 |
| 2024 | $5,537 | $497,601 | $348,462 | $149,139 |
| 2023 | $5,365 | $487,845 | $341,630 | $146,215 |
| 2022 | $5,282 | $478,281 | $334,932 | $143,349 |
| 2021 | $5,301 | $468,904 | $328,365 | $140,539 |
| 2020 | $5,137 | $464,097 | $324,999 | $139,098 |
| 2019 | $4,987 | $454,998 | $318,627 | $136,371 |
| 2018 | $4,933 | $446,078 | $312,380 | $133,698 |
| 2017 | $70 | $437,332 | $306,255 | $131,077 |
| 2016 | $4,256 | $390,000 | $276,000 | $114,000 |
| 2015 | $3,870 | $360,000 | $255,000 | $105,000 |
| 2014 | $3,455 | $328,000 | $233,000 | $95,000 |
Source: Public Records
Map
Nearby Homes
- 168 Carey Rd
- 2309 Saratoga St
- 506 Canyon Dr Unit 6
- 0 Amick St Unit 146-100-23-00, 21, 1
- 2721 Lomita St
- 2861 Turnbull St
- 230 Hoover St
- 2904 E Barnwell St
- 415 Stoney Point Way Unit 106
- 2937 E Barnwell St
- 420 Stoney Point Way Unit 113
- 430 Stoney Point Way Unit 124
- 1432 Buena St
- 1328 Buena St
- 503 505 N Nevada St
- 722 &718 N Freeman St
- 1330 Bush St
- 540 S Barnwell St
- 509 Rockledge St
- 519 Camelot Dr
Your Personal Tour Guide
Ask me questions while you tour the home.