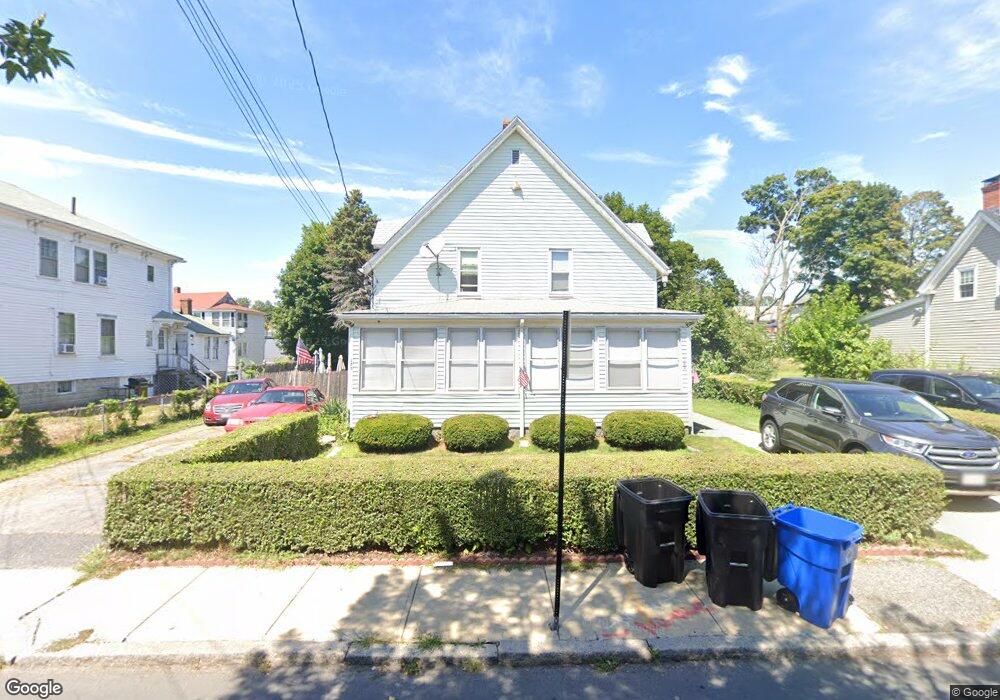
169 Crescent St Quincy, MA 02169
South Quincy NeighborhoodEstimated Value: $803,000 - $850,000
4
Beds
2
Baths
2,079
Sq Ft
$398/Sq Ft
Est. Value
About This Home
This home is located at 169 Crescent St, Quincy, MA 02169 and is currently estimated at $827,295, approximately $397 per square foot. 169 Crescent St is a home located in Norfolk County with nearby schools including South West Middle School, Lincoln-Hancock Community School, and Quincy High School.
Ownership History
Date
Name
Owned For
Owner Type
Purchase Details
Closed on
Mar 25, 2004
Sold by
Henriksen Anna M I and Iacobucci Anna M
Bought by
Henriksen Mark
Current Estimated Value
Home Financials for this Owner
Home Financials are based on the most recent Mortgage that was taken out on this home.
Original Mortgage
$275,000
Outstanding Balance
$128,343
Interest Rate
5.65%
Mortgage Type
Purchase Money Mortgage
Estimated Equity
$698,952
Create a Home Valuation Report for This Property
The Home Valuation Report is an in-depth analysis detailing your home's value as well as a comparison with similar homes in the area
Home Values in the Area
Average Home Value in this Area
Purchase History
| Date | Buyer | Sale Price | Title Company |
|---|---|---|---|
| Henriksen Mark | $365,000 | -- |
Source: Public Records
Mortgage History
| Date | Status | Borrower | Loan Amount |
|---|---|---|---|
| Open | Henriksen Mark | $275,000 |
Source: Public Records
Tax History Compared to Growth
Tax History
| Year | Tax Paid | Tax Assessment Tax Assessment Total Assessment is a certain percentage of the fair market value that is determined by local assessors to be the total taxable value of land and additions on the property. | Land | Improvement |
|---|---|---|---|---|
| 2025 | $8,471 | $734,700 | $320,600 | $414,100 |
| 2024 | $7,981 | $708,200 | $305,800 | $402,400 |
| 2023 | $7,503 | $674,100 | $291,700 | $382,400 |
| 2022 | $7,152 | $597,000 | $235,000 | $362,000 |
| 2021 | $6,659 | $548,500 | $235,000 | $313,500 |
| 2020 | $6,819 | $548,600 | $235,000 | $313,600 |
| 2019 | $6,481 | $516,400 | $228,500 | $287,900 |
| 2018 | $6,530 | $489,500 | $212,200 | $277,300 |
| 2017 | $6,133 | $432,800 | $202,500 | $230,300 |
| 2016 | $5,615 | $391,000 | $184,900 | $206,100 |
| 2015 | $5,541 | $379,500 | $174,900 | $204,600 |
| 2014 | $5,042 | $339,300 | $174,900 | $164,400 |
Source: Public Records
Map
Nearby Homes
- 230 Willard St Unit 204
- 328 Copeland St Unit 3E
- 2 Ricciuti Dr Unit 8
- 29 Oconnell Ave
- 41 Filbert St
- 73 Connell St
- 211 Copeland St
- 28 Miller St Unit 8
- 145 Suomi Rd Unit C7
- 47 Connell St
- 141 Gardiner Rd
- 111 Shawmut St
- 9 Common St Unit 3
- 37 Wren Terrace Unit 2
- 19 Seymour St
- 57A West St
- 64 Shawmut St
- 27 Shirley St
- 52 Bunker Hill Ln
- 85 Gridley St
- 165 Crescent St
- 173 Crescent St Unit 175
- 173 Crescent St Unit 1
- 272 Willard St
- 109 Hall Place
- 159 Crescent St
- 159 Crescent St Unit 2
- 159 Crescent St Unit 1
- 111 Hall Place
- 258 Willard St
- 279 Willard St Unit 205
- 279 Willard St
- 279 Willard St Unit 306
- 279 Willard St Unit 201
- 279 Willard St Unit 204
- 279 Willard St Unit 202
- 279 Willard St Unit 303
- 279 Willard St Unit 304
- 279 Willard St Unit 302
- 279 Willard St Unit 206