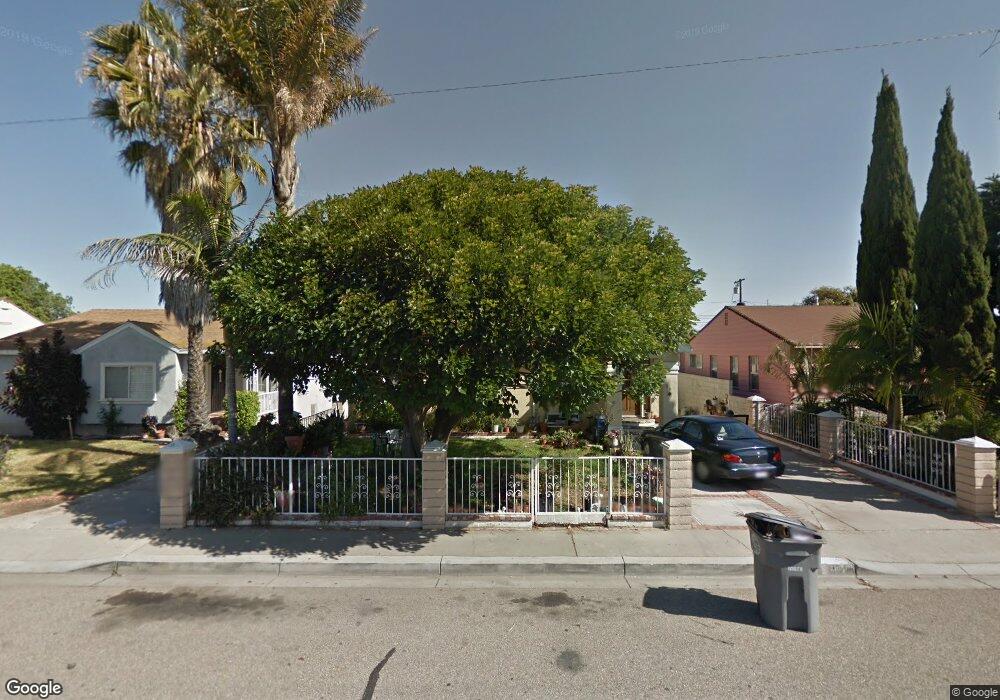
169 E Date St Oxnard, CA 93033
Cal-Gisler NeighborhoodEstimated Value: $651,000 - $679,000
4
Beds
3
Baths
1,590
Sq Ft
$419/Sq Ft
Est. Value
About This Home
This home is located at 169 E Date St, Oxnard, CA 93033 and is currently estimated at $666,856, approximately $419 per square foot. 169 E Date St is a home located in Ventura County with nearby schools including Elm Street Elementary School, R.J. Frank Academy of Marine Science & Engineering, and Santa Clara High School.
Ownership History
Date
Name
Owned For
Owner Type
Purchase Details
Closed on
Aug 24, 2006
Sold by
Valdez Antonio C and Valdez Celia
Bought by
Valdez Antonio C and Valdez Celia
Current Estimated Value
Home Financials for this Owner
Home Financials are based on the most recent Mortgage that was taken out on this home.
Original Mortgage
$320,000
Interest Rate
1.5%
Mortgage Type
Negative Amortization
Purchase Details
Closed on
Apr 1, 2003
Sold by
Valdez Juana
Bought by
Valdez Antonio C and Valdez Celia
Create a Home Valuation Report for This Property
The Home Valuation Report is an in-depth analysis detailing your home's value as well as a comparison with similar homes in the area
Home Values in the Area
Average Home Value in this Area
Purchase History
| Date | Buyer | Sale Price | Title Company |
|---|---|---|---|
| Valdez Antonio C | -- | Alliance Title Company | |
| Valdez Antonio C | -- | -- |
Source: Public Records
Mortgage History
| Date | Status | Borrower | Loan Amount |
|---|---|---|---|
| Closed | Valdez Antonio C | $320,000 |
Source: Public Records
Tax History
| Year | Tax Paid | Tax Assessment Tax Assessment Total Assessment is a certain percentage of the fair market value that is determined by local assessors to be the total taxable value of land and additions on the property. | Land | Improvement |
|---|---|---|---|---|
| 2025 | $823 | $63,895 | $20,736 | $43,159 |
| 2024 | $823 | $62,643 | $20,330 | $42,313 |
| 2023 | $794 | $61,415 | $19,931 | $41,484 |
| 2022 | $771 | $60,211 | $19,540 | $40,671 |
| 2021 | $766 | $59,031 | $19,157 | $39,874 |
| 2020 | $779 | $58,427 | $18,961 | $39,466 |
| 2019 | $758 | $57,283 | $18,590 | $38,693 |
| 2018 | $748 | $56,161 | $18,226 | $37,935 |
| 2017 | $712 | $55,061 | $17,869 | $37,192 |
| 2016 | $689 | $53,982 | $17,519 | $36,463 |
| 2015 | $695 | $53,172 | $17,256 | $35,916 |
| 2014 | $688 | $52,132 | $16,919 | $35,213 |
Source: Public Records
Map
Nearby Homes
- 225 W Iris St
- 1239 S C St
- 1127 S C St
- 2024 S J St
- 865 S B St Unit Q1
- 819 S B St Unit 34
- 633 Meta St
- 1030 Ilena St
- 2151 E Wooley Rd
- 3151 Fournier St
- 3130 Paula St
- 603 S G St
- 550 S G St
- 807 Kingfisher Way
- 1174 Oyster Place Unit 15
- 1501 Pisco Ln
- 1431 Casa San Carlos Ln Unit B
- 1231 Lost Point Ln
- 1309 Nautical Way
- 403 E 2nd St
Your Personal Tour Guide
Ask me questions while you tour the home.