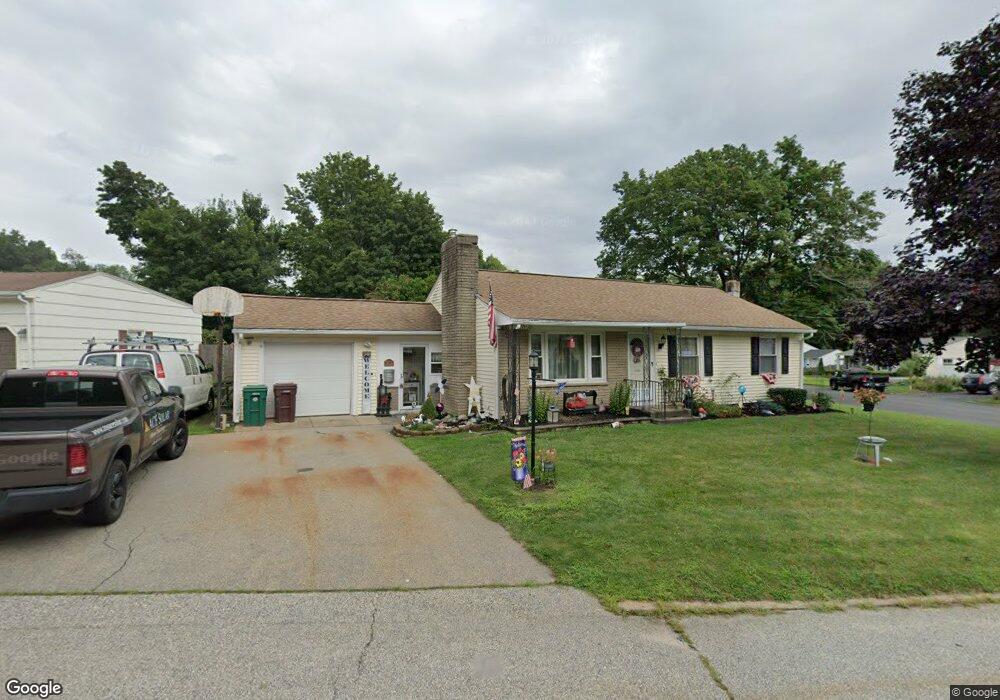
169 Macarthur Rd Woonsocket, RI 02895
East Woonsocket NeighborhoodEstimated Value: $388,000 - $416,456
3
Beds
2
Baths
1,740
Sq Ft
$232/Sq Ft
Est. Value
About This Home
This home is located at 169 Macarthur Rd, Woonsocket, RI 02895 and is currently estimated at $404,364, approximately $232 per square foot. 169 Macarthur Rd is a home located in Providence County with nearby schools including Woonsocket High School and Good Shepherd Catholic School.
Ownership History
Date
Name
Owned For
Owner Type
Purchase Details
Closed on
Aug 26, 2019
Sold by
Champagne Tracy D
Bought by
Champagne Tracy D and Champagne Michael
Current Estimated Value
Home Financials for this Owner
Home Financials are based on the most recent Mortgage that was taken out on this home.
Original Mortgage
$216,218
Outstanding Balance
$189,901
Interest Rate
4.25%
Mortgage Type
FHA
Estimated Equity
$214,463
Create a Home Valuation Report for This Property
The Home Valuation Report is an in-depth analysis detailing your home's value as well as a comparison with similar homes in the area
Home Values in the Area
Average Home Value in this Area
Purchase History
| Date | Buyer | Sale Price | Title Company |
|---|---|---|---|
| Champagne Tracy D | -- | -- | |
| Champagne Tracy D | -- | -- |
Source: Public Records
Mortgage History
| Date | Status | Borrower | Loan Amount |
|---|---|---|---|
| Open | Champagne Tracy D | $216,218 | |
| Closed | Champagne Tracy D | $216,218 |
Source: Public Records
Tax History
| Year | Tax Paid | Tax Assessment Tax Assessment Total Assessment is a certain percentage of the fair market value that is determined by local assessors to be the total taxable value of land and additions on the property. | Land | Improvement |
|---|---|---|---|---|
| 2025 | $4,239 | $377,500 | $104,700 | $272,800 |
| 2024 | $3,911 | $269,000 | $85,400 | $183,600 |
| 2023 | $3,761 | $269,000 | $85,400 | $183,600 |
| 2022 | $3,761 | $269,000 | $85,400 | $183,600 |
| 2021 | $3,705 | $156,000 | $66,800 | $89,200 |
| 2020 | $3,744 | $156,000 | $66,800 | $89,200 |
| 2018 | $3,756 | $156,000 | $66,800 | $89,200 |
| 2017 | $4,389 | $145,800 | $63,300 | $82,500 |
| 2016 | $4,642 | $145,800 | $63,300 | $82,500 |
| 2015 | $5,333 | $145,800 | $63,300 | $82,500 |
| 2014 | $5,272 | $146,700 | $69,700 | $77,000 |
Source: Public Records
Map
Nearby Homes
- 727 Mendon Rd
- 95 Mitris Blvd
- 68 Kenwood St
- 202 Paine St
- 1088 Diamond Hill Rd
- 194 Paine St
- 212 Saint Louis Ave
- 188 Saint Louis Ave
- 178 Saint Louis Ave
- 375 Congress St
- 82 Paine St
- 568 Elm St
- 34 Heroux Ave
- 4 Carnation St
- 21 Irving St
- 56 Mailloux St
- 538 Wood Ave
- 311 Elm St
- Lot 2 Pulaski Blvd
- 101 Pine Grove Ave
Your Personal Tour Guide
Ask me questions while you tour the home.