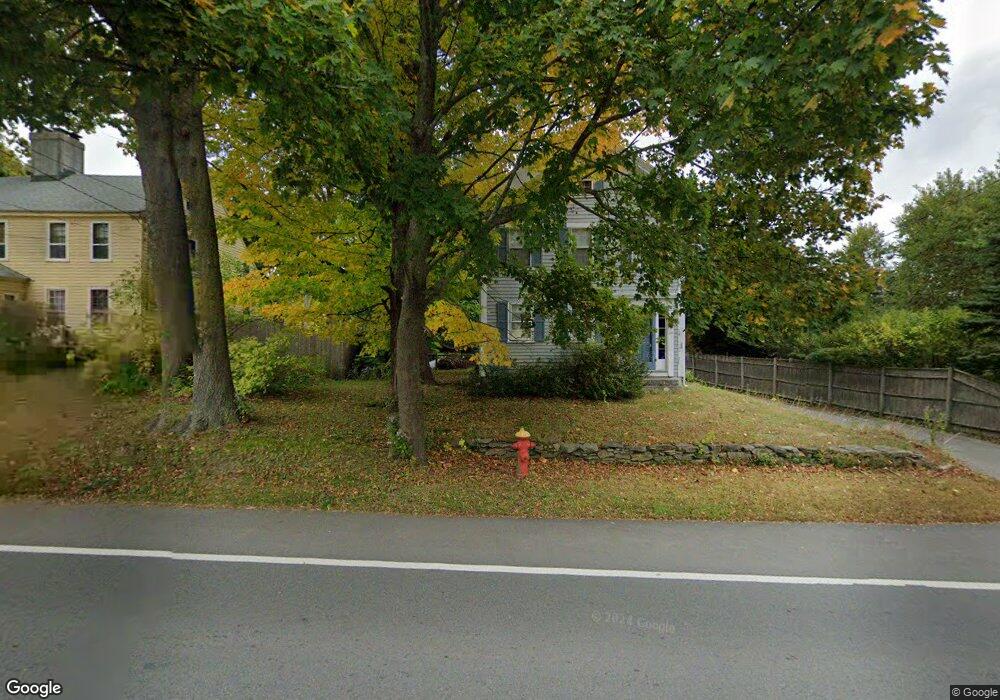
169 Main St West Newbury, MA 01985
Estimated Value: $723,000 - $834,000
2
Beds
2
Baths
1,978
Sq Ft
$389/Sq Ft
Est. Value
About This Home
This home is located at 169 Main St, West Newbury, MA 01985 and is currently estimated at $769,872, approximately $389 per square foot. 169 Main St is a home located in Essex County with nearby schools including Pentucket Regional High School.
Ownership History
Date
Name
Owned For
Owner Type
Purchase Details
Closed on
Dec 15, 2006
Sold by
King Rebecca M
Bought by
Hall Robert M and Hall Debbie A
Current Estimated Value
Home Financials for this Owner
Home Financials are based on the most recent Mortgage that was taken out on this home.
Original Mortgage
$320,000
Outstanding Balance
$191,321
Interest Rate
6.31%
Mortgage Type
Purchase Money Mortgage
Estimated Equity
$578,551
Purchase Details
Closed on
Mar 17, 2005
Sold by
Sonia Barbara A and Sonia James L
Bought by
King Rebecca M
Home Financials for this Owner
Home Financials are based on the most recent Mortgage that was taken out on this home.
Original Mortgage
$210,000
Interest Rate
5.64%
Mortgage Type
Purchase Money Mortgage
Create a Home Valuation Report for This Property
The Home Valuation Report is an in-depth analysis detailing your home's value as well as a comparison with similar homes in the area
Home Values in the Area
Average Home Value in this Area
Purchase History
| Date | Buyer | Sale Price | Title Company |
|---|---|---|---|
| Hall Robert M | $334,000 | -- | |
| King Rebecca M | $387,500 | -- |
Source: Public Records
Mortgage History
| Date | Status | Borrower | Loan Amount |
|---|---|---|---|
| Open | King Rebecca M | $320,000 | |
| Previous Owner | King Rebecca M | $210,000 | |
| Previous Owner | King Rebecca M | $120,000 | |
| Previous Owner | King Rebecca M | $122,007 |
Source: Public Records
Tax History Compared to Growth
Tax History
| Year | Tax Paid | Tax Assessment Tax Assessment Total Assessment is a certain percentage of the fair market value that is determined by local assessors to be the total taxable value of land and additions on the property. | Land | Improvement |
|---|---|---|---|---|
| 2025 | $6,750 | $625,000 | $237,600 | $387,400 |
| 2024 | $6,888 | $636,600 | $268,000 | $368,600 |
| 2023 | $6,632 | $601,300 | $258,600 | $342,700 |
| 2022 | $6,574 | $505,300 | $202,600 | $302,700 |
| 2021 | $6,436 | $432,500 | $185,700 | $246,800 |
| 2020 | $6,237 | $432,500 | $185,700 | $246,800 |
| 2019 | $5,933 | $407,200 | $160,400 | $246,800 |
| 2018 | $5,609 | $385,200 | $160,400 | $224,800 |
| 2017 | $5,530 | $380,100 | $155,300 | $224,800 |
| 2016 | $5,521 | $377,400 | $155,300 | $222,100 |
| 2015 | $5,222 | $332,800 | $123,200 | $209,600 |
Source: Public Records
Map
Nearby Homes
- 3 Marshall Dr
- 4 Barberry Ln
- 29 Pleasant St
- 70 Maple St
- 27 Rivercrest Dr
- 31 Rivercrest Dr
- 22-26 Wood St
- 43 Prospect St
- 167 Middle St
- 4 Stewart St Unit 4
- 20 Albion Ln
- 126 Georgetown Rd
- 0 E Broadway Unit 73335816
- 11 Albion Ln
- 53 Old Amesbury Line Rd
- 2 River Rd
- 280 E Broadway
- 528 Main St Unit A
- 412 Middle St
- 33 Groveland Commons Way